Key Intraday Data:
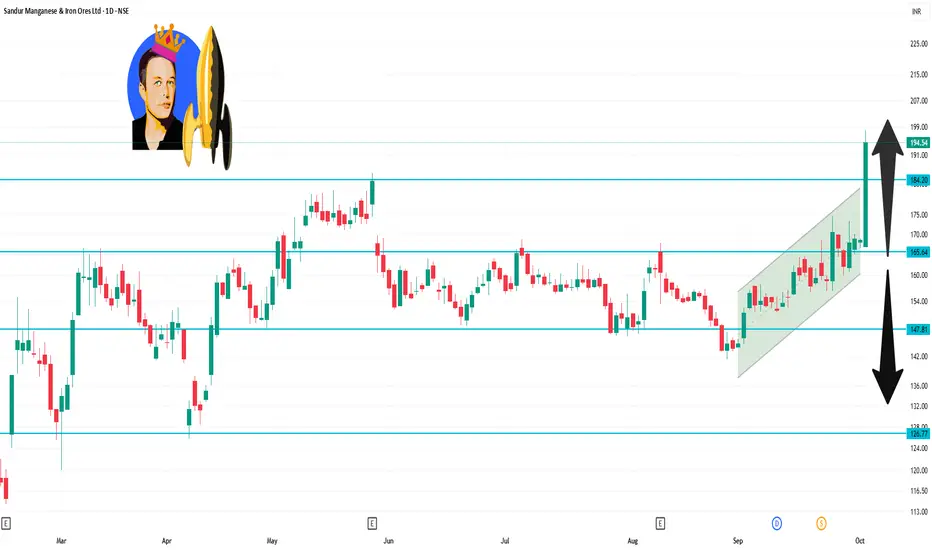
Opening Price: ₹167.00
Closing Price: ₹194.40
Day’s Range: ₹166.85 – ₹198.10
52-Week Range: ₹112.77 – ₹198.10
Volume Traded: Approximately 36.3 million shares
Market Capitalization: ₹9,457 crore
The stock closed at ₹194.40, marking a 15.34% increase from the previous close of ₹168.54. It also achieved a new 52-week high of ₹198.10 during the day.
Technical Indicators:
Technical analysis indicates a strong bullish trend for the stock. The Relative Strength Index (RSI) stands at 78.05, suggesting that the stock is approaching overbought territory.
Verbundene Veröffentlichungen
Haftungsausschluss
Die Informationen und Veröffentlichungen sind nicht als Finanz-, Anlage-, Handels- oder andere Arten von Ratschlägen oder Empfehlungen gedacht, die von TradingView bereitgestellt oder gebilligt werden, und stellen diese nicht dar. Lesen Sie mehr in den Nutzungsbedingungen.