CHART ANALYSIS & BIAS
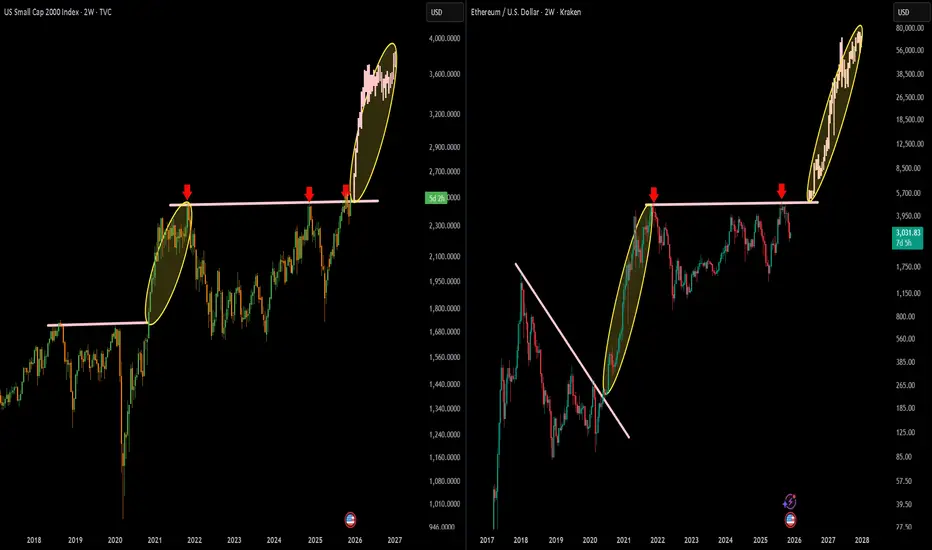
I am comparing US Small Caps (Russell 2000) on the left with Ethereum (ETH) on the right.
Both charts show identical structural behavior:
A long multi-year accumulation / resistance zone
A clean breakout
A vertical markup phase immediately after reclaiming the key level
Strong momentum continuation inside the yellow ellipse
My comparison highlights that ETH tends to follow macro-risk assets, especially small caps, during high-liquidity phases.
📈 LEFT CHART – RUSSELL 2000 (Small Caps)
Key Observations:
Multi-year resistance around 2,350–2,400 (pink line) rejected price multiple times.
When broken in 2020–2021, price exploded +41.79% (highlighted region).
Current breakout (2025) is replicating the same behavior:
Strong impulse
Consecutive bullish candles
No meaningful retracement yet
Risk-on money rotating back into small caps
Macro Implication
Small caps pump when liquidity returns → very bullish signal for crypto.
📈 RIGHT CHART – ETHEREUM (ETH/USD)
Key Observations:
Clean downtrend break in 2020 triggered a +2,264% mega rally (your highlighted zone).
ETH is now doing the same pattern:
Broke a multi-year neckline around $3,950–$4,000
Strong breakout continuation
Vertical markup phase identical to 2020 run
Market Structure
ETH is:
✔ In price discovery mode
✔ Above all major resistances
✔ Showing strong momentum after multi-year accumulation
✔ Mirroring small-cap breakout behavior
📌 FINAL BIAS (COMBINED MACRO + TECHNICAL)
🔥 My Bias is STRONGLY BULLISH for ETH (and crypto overall).
Why?
Macro liquidity rotation → small caps leading = historically extremely positive for crypto.
ETH repeating its 2020 breakout structure → identical vertical markup formation.
Multi-year resistance reclaimed → ETH enters the expansion phase of bullish cycle.
No real resistance above until $7k–$8k based on structure.
Confluence between traditional risk assets & ETH confirms the breakout strength.
🎯 Short-Term Bias (Next Weeks)
Bullish continuation
Possible shallow pullbacks but structure is aggressively upward
Targets: $4,800 → $5,700 → $7,000
🎯 Mid-Term Bias (Cycle Outlook)
ETH mirrors its previous cycle: strong markup phase
Potential targets: $10,000–$14,000 within cycle expansion
Haftungsausschluss
Die Informationen und Veröffentlichungen sind nicht als Finanz-, Anlage-, Handels- oder andere Arten von Ratschlägen oder Empfehlungen gedacht, die von TradingView bereitgestellt oder gebilligt werden, und stellen diese nicht dar. Lesen Sie mehr in den Nutzungsbedingungen.
Haftungsausschluss
Die Informationen und Veröffentlichungen sind nicht als Finanz-, Anlage-, Handels- oder andere Arten von Ratschlägen oder Empfehlungen gedacht, die von TradingView bereitgestellt oder gebilligt werden, und stellen diese nicht dar. Lesen Sie mehr in den Nutzungsbedingungen.