https://www.tradingview.com/x/mFwswPSt
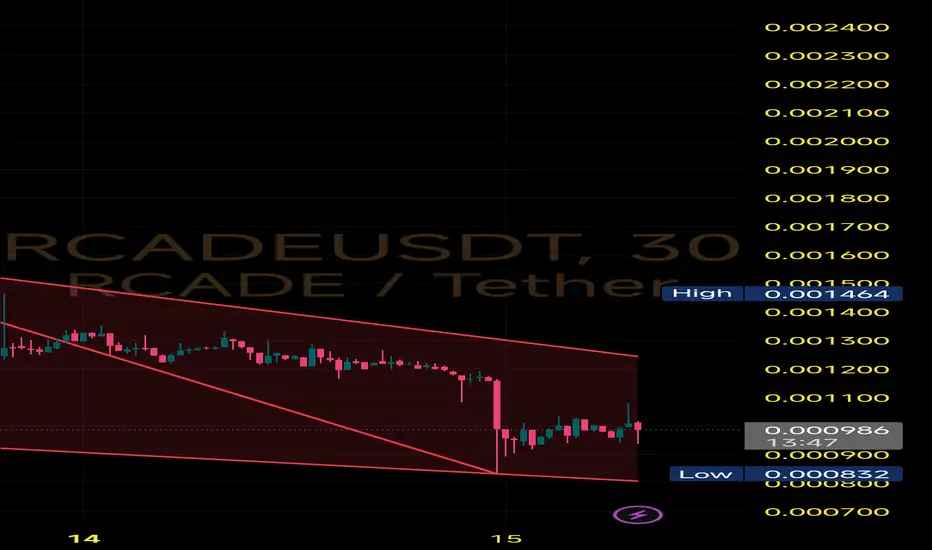
A falling wedge is formed when price makes lower highs and lower lows within converging trendlines. It’s typically a bullish pattern, especially after an extended downtrend like this one.
Current Situation - Price touched the lower wedge boundary at $0.000832 (latest local low)
Multiple taps on both support and resistance trendlines confirm wedge validity
Quick rebound from the wedge bottom hints that buyers are stepping in
🔹Breakout zone above $0.00110–$0.00115 could trigger rapid move
🔸Immediate resistance levels: $0.00130 → $0.00150 → $0.00180
⚠️ Invalidation:
A breakdown below $0.00083 with high volume would invalidate the wedge and resume the downtrend.
Haftungsausschluss
Die Informationen und Veröffentlichungen sind nicht als Finanz-, Anlage-, Handels- oder andere Arten von Ratschlägen oder Empfehlungen gedacht, die von TradingView bereitgestellt oder gebilligt werden, und stellen diese nicht dar. Lesen Sie mehr in den Nutzungsbedingungen.
Haftungsausschluss
Die Informationen und Veröffentlichungen sind nicht als Finanz-, Anlage-, Handels- oder andere Arten von Ratschlägen oder Empfehlungen gedacht, die von TradingView bereitgestellt oder gebilligt werden, und stellen diese nicht dar. Lesen Sie mehr in den Nutzungsbedingungen.