📈 1-Hour Intraday Technical Overview
Based on the latest intraday data, here's a snapshot of RAMKY's performance:
Current Price: ₹687.10
Daily Range: ₹594.40 – ₹705.00
Volume: Approximately 6.4 million shares
RSI (Relative Strength Index): 73.06 (indicating overbought conditions)
MACD (Moving Average Convergence Divergence): 11.03 (bullish momentum)
ADX (Average Directional Index): 23.81 (moderate trend strength)
Supertrend Indicator: ₹560.31 (suggesting an upward trend)
Parabolic SAR: ₹557.45 (supporting bullish trend)
Rate of Change (ROC): 14.39% (indicating strong momentum)
Chaikin Money Flow (CMF): 0.358 (positive accumulation)
Williams %R: -12.13 (approaching overbought territory)
Stochastic Oscillator: 36.47 (neutral, with potential for upward movement)
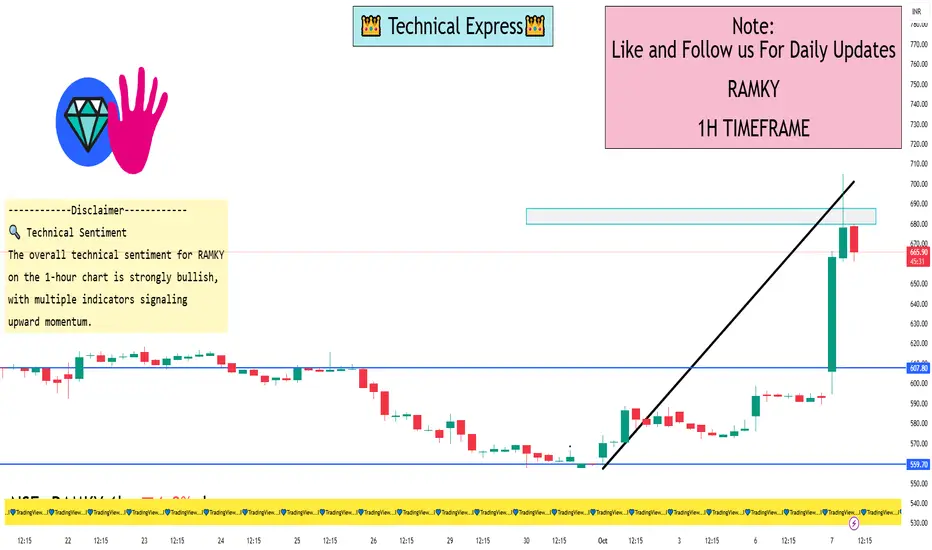
🔍 Technical Sentiment
The overall technical sentiment for RAMKY on the 1-hour chart is strongly bullish, with multiple indicators signaling upward momentum. However, the high RSI suggests that the stock may be approaching overbought levels, indicating a potential for short-term consolidation or pullback.
Based on the latest intraday data, here's a snapshot of RAMKY's performance:
Current Price: ₹687.10
Daily Range: ₹594.40 – ₹705.00
Volume: Approximately 6.4 million shares
RSI (Relative Strength Index): 73.06 (indicating overbought conditions)
MACD (Moving Average Convergence Divergence): 11.03 (bullish momentum)
ADX (Average Directional Index): 23.81 (moderate trend strength)
Supertrend Indicator: ₹560.31 (suggesting an upward trend)
Parabolic SAR: ₹557.45 (supporting bullish trend)
Rate of Change (ROC): 14.39% (indicating strong momentum)
Chaikin Money Flow (CMF): 0.358 (positive accumulation)
Williams %R: -12.13 (approaching overbought territory)
Stochastic Oscillator: 36.47 (neutral, with potential for upward movement)
🔍 Technical Sentiment
The overall technical sentiment for RAMKY on the 1-hour chart is strongly bullish, with multiple indicators signaling upward momentum. However, the high RSI suggests that the stock may be approaching overbought levels, indicating a potential for short-term consolidation or pullback.
I built a Buy & Sell Signal Indicator with 85% accuracy.
📈 Get access via DM or
WhatsApp: wa.link/d997q0
Contact - +91 76782 40962
| Email: techncialexpress@gmail.com
| Script Coder | Trader | Investor | From India
📈 Get access via DM or
WhatsApp: wa.link/d997q0
Contact - +91 76782 40962
| Email: techncialexpress@gmail.com
| Script Coder | Trader | Investor | From India
Verbundene Veröffentlichungen
Haftungsausschluss
Die Informationen und Veröffentlichungen sind nicht als Finanz-, Anlage-, Handels- oder andere Arten von Ratschlägen oder Empfehlungen gedacht, die von TradingView bereitgestellt oder gebilligt werden, und stellen diese nicht dar. Lesen Sie mehr in den Nutzungsbedingungen.