🧪 Fundamentals / Business Snapshot
What they do: Privi Speciality Chemicals is a major Indian manufacturer, exporter, and supplier of aroma & fragrance chemicals. Their capability includes many complex operations (distillation, condensation, hydrogenation etc).
Recent financials:
• In FY25, revenue rose ~ 19.9 % to ~ ₹2,101.19 crore from ~ ₹1,752.23 Cr prev year.
• Net profit nearly doubled—~ 97 % YoY to ~ ₹187.00 crore vs ~ ₹94.91 Cr the previous year.
• In the most recent quarter (Q1 FY26), revenue ~ ₹567.80 Cr (up ~21.7 % YoY), net profit ~ ₹61.93 Cr (up ~97.4 % YoY).
Margins / Efficiency:
• Operating / EBITDA margins have improved. For example, in recent quarters the OPM has been ~ 20-23 % in some reports.
• ROE recently ~ 16.94 % vs its 5-yr average ~11.8 %.
Risks / concerns:
• Some analysts / rating agencies see weaker long-term fundamentals: slow growth in net sales / operating profit over longer horizon, high debt/EBITDA in some reports.
• Commodity input risk, foreign exchange risk (since exports are significant), margin pressure possible. (General for speciality chemicals)
Competitive / strategic positives:
• Strong R&D, product mix improvements.
• Export orientation gives access to global markets.
---
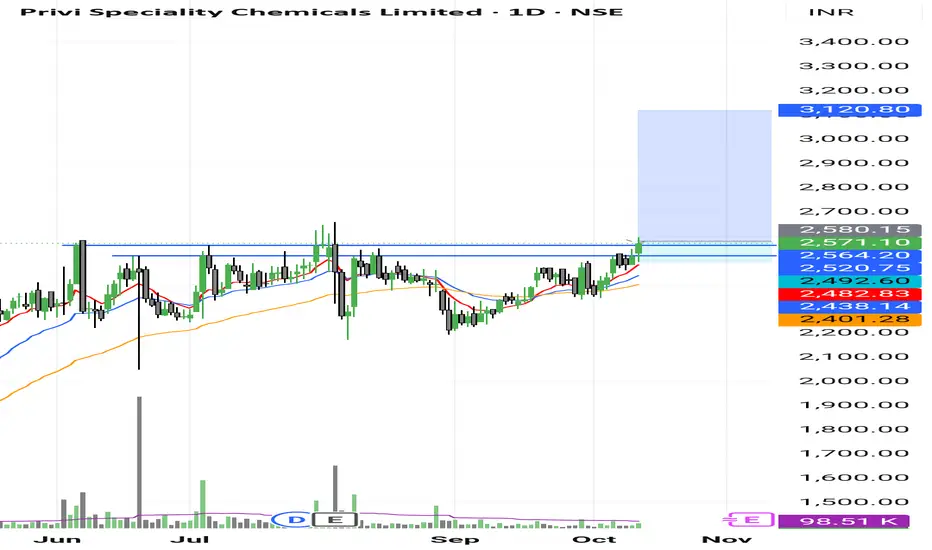
📊 Technical / Price Action View
Current trend & moving averages: According to ETMoney, the stock is hovering around key moving averages: the 20, 50, 100, 200-day EMAs/SMAs are giving “neutral” signals in many cases.
Momentum indicators:
• RSI (14) ~ 48-50 area → neutral territory.
• MACD in some sources is slightly negative or weak → indicates not strong momentum up currently.
• Some resistance / support zones via pivot / classic technical tools: TipRanks shows pivot at ~ ₹2338, with resistance above and support below.
Recent behaviour:
• The stock has hit 52-week highs in recent past, showing strong sentiment after good results.
• However, price also seems to be consolidating / facing short-term corrections (QoQ revenue drops, expenses growth) in some quarters.
What they do: Privi Speciality Chemicals is a major Indian manufacturer, exporter, and supplier of aroma & fragrance chemicals. Their capability includes many complex operations (distillation, condensation, hydrogenation etc).
Recent financials:
• In FY25, revenue rose ~ 19.9 % to ~ ₹2,101.19 crore from ~ ₹1,752.23 Cr prev year.
• Net profit nearly doubled—~ 97 % YoY to ~ ₹187.00 crore vs ~ ₹94.91 Cr the previous year.
• In the most recent quarter (Q1 FY26), revenue ~ ₹567.80 Cr (up ~21.7 % YoY), net profit ~ ₹61.93 Cr (up ~97.4 % YoY).
Margins / Efficiency:
• Operating / EBITDA margins have improved. For example, in recent quarters the OPM has been ~ 20-23 % in some reports.
• ROE recently ~ 16.94 % vs its 5-yr average ~11.8 %.
Risks / concerns:
• Some analysts / rating agencies see weaker long-term fundamentals: slow growth in net sales / operating profit over longer horizon, high debt/EBITDA in some reports.
• Commodity input risk, foreign exchange risk (since exports are significant), margin pressure possible. (General for speciality chemicals)
Competitive / strategic positives:
• Strong R&D, product mix improvements.
• Export orientation gives access to global markets.
---
📊 Technical / Price Action View
Current trend & moving averages: According to ETMoney, the stock is hovering around key moving averages: the 20, 50, 100, 200-day EMAs/SMAs are giving “neutral” signals in many cases.
Momentum indicators:
• RSI (14) ~ 48-50 area → neutral territory.
• MACD in some sources is slightly negative or weak → indicates not strong momentum up currently.
• Some resistance / support zones via pivot / classic technical tools: TipRanks shows pivot at ~ ₹2338, with resistance above and support below.
Recent behaviour:
• The stock has hit 52-week highs in recent past, showing strong sentiment after good results.
• However, price also seems to be consolidating / facing short-term corrections (QoQ revenue drops, expenses growth) in some quarters.
Haftungsausschluss
Die Informationen und Veröffentlichungen sind nicht als Finanz-, Anlage-, Handels- oder andere Arten von Ratschlägen oder Empfehlungen gedacht, die von TradingView bereitgestellt oder gebilligt werden, und stellen diese nicht dar. Lesen Sie mehr in den Nutzungsbedingungen.
Haftungsausschluss
Die Informationen und Veröffentlichungen sind nicht als Finanz-, Anlage-, Handels- oder andere Arten von Ratschlägen oder Empfehlungen gedacht, die von TradingView bereitgestellt oder gebilligt werden, und stellen diese nicht dar. Lesen Sie mehr in den Nutzungsbedingungen.