📈 PCBL – Breakout from Symmetrical Triangle | Bullish Momentum Building 🚀
📌 Symbol: PCBL CHEMICAL LTD – NSE
🕒 Timeframe: Daily
💰 CMP: ₹431.85 (+6.80%)
📆 Date: July 9, 2025
🔷 Technical Summary:
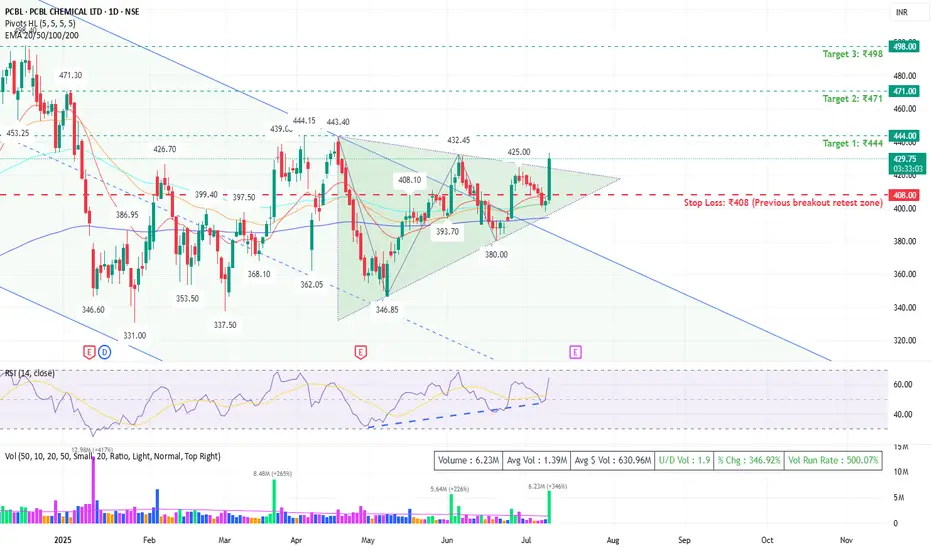
PCBL has given a strong breakout above a well-formed *symmetrical triangle* with significant volume support. Price action indicates trend reversal from a long-term falling channel.
✅ Key Bullish Signals:
• Symmetrical triangle breakout above ₹425
• Bullish engulfing candle with 271% spike in volume
• RSI at 65 – strong but not overbought
• Price trading above all major EMAs (20/50/100/200)
• Vol Run Rate: 390% – confirms strong market participation
📊 Support & Resistance Levels:
• Support: ₹408 / ₹393.70 / ₹362
• Resistance: ₹444.15 / ₹471.30 / ₹498.40
📈 Trade Setup (Positional):
• Buy Zone: ₹425–₹432 (on dips or sustained close above ₹432)
• Target 1: ₹444
• Target 2: ₹471
• Target 3: ₹498
• Stop Loss: ₹408 (below breakout zone)
🧠 Analyst Note:
This breakout comes after months of consolidation and offers a favorable risk-reward ratio. Watch for follow-through above ₹444–₹448 for confirmation of a larger uptrend.
📢 Disclaimer: This is not investment advice. Please consult your financial advisor before making any trading decisions.
Haftungsausschluss
Die Informationen und Veröffentlichungen sind nicht als Finanz-, Anlage-, Handels- oder andere Arten von Ratschlägen oder Empfehlungen gedacht, die von TradingView bereitgestellt oder gebilligt werden, und stellen diese nicht dar. Lesen Sie mehr in den Nutzungsbedingungen.
Haftungsausschluss
Die Informationen und Veröffentlichungen sind nicht als Finanz-, Anlage-, Handels- oder andere Arten von Ratschlägen oder Empfehlungen gedacht, die von TradingView bereitgestellt oder gebilligt werden, und stellen diese nicht dar. Lesen Sie mehr in den Nutzungsbedingungen.