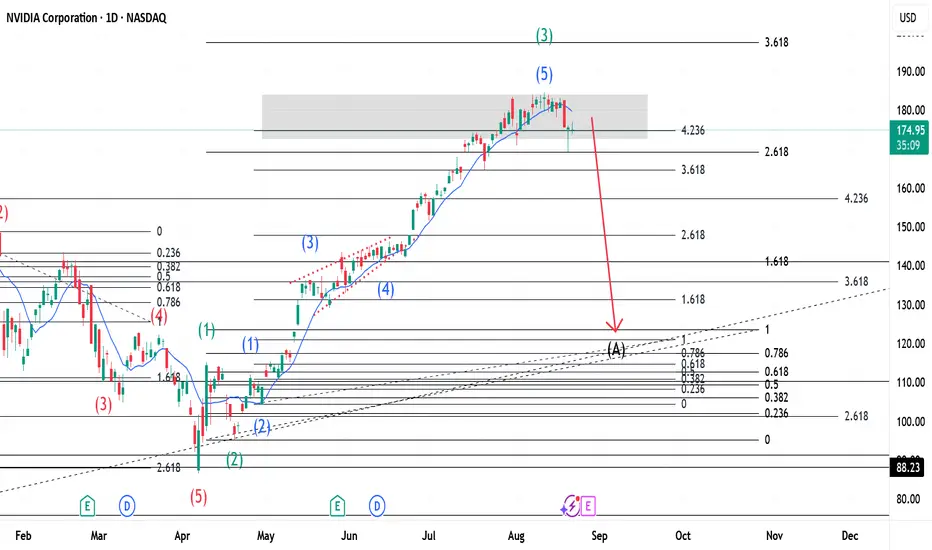
This is an update of a previous publication(link below). With price above the 423% Fib. level, this means that there is overbuying. Using Elliott Wave Theory we can see that Wave 3(Green) is complete with 5 waves(shown in Blue) inside it. What should follow from this is a Flat correction for Wave 4(Green) because Wave 2(Green) was a Zigzag. The Red arrow shows price direction only and points to a Wave A(Black) as our first wave for the Zigzag. This arrow does not show precise price ending rather shows direction. For more on the same, go to:

Haftungsausschluss
Die Informationen und Veröffentlichungen sind nicht als Finanz-, Anlage-, Handels- oder andere Arten von Ratschlägen oder Empfehlungen gedacht, die von TradingView bereitgestellt oder gebilligt werden, und stellen diese nicht dar. Lesen Sie mehr in den Nutzungsbedingungen.
Haftungsausschluss
Die Informationen und Veröffentlichungen sind nicht als Finanz-, Anlage-, Handels- oder andere Arten von Ratschlägen oder Empfehlungen gedacht, die von TradingView bereitgestellt oder gebilligt werden, und stellen diese nicht dar. Lesen Sie mehr in den Nutzungsbedingungen.