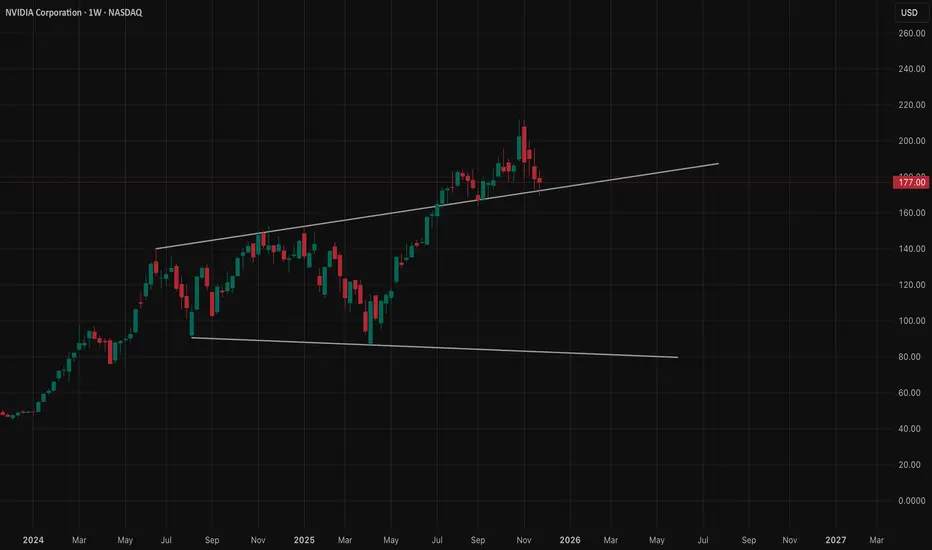
Weekly – Trend Still Up, But Losing Strength
NVDA has been riding a strong multi-month uptrend, but the last few weekly candles show the first real slowdown. A clear CHoCH formed near the recent highs, and sellers stepped in aggressively. The weekly candle closed with a long upper wick and a heavier body — signaling momentum cooling.
Important weekly zones:
* $198–200: previous weekly supply
* $176–178: weekly support where buyers stepped in
* $153–160: deeper weekly demand
* $120s: major demand if the market rolls over hard
Weekly tone → still bullish on the big structure, but fading momentum with the first signs of deeper pullback potential.
Daily – Inside a Pullback After Supply Rejection

Daily shows a sharp rejection from the supply zone near $210–215. Price broke structure downward (CHoCH), then bounced from a lower demand zone but hasn’t reclaimed the supply above.
Daily key levels:
* Resistance: $198 → $212
* Support: $177 → $172
Until price fully reclaims and holds above $198–200, NVDA stays at risk for lower continuation.
Daily tone → trapped underneath supply, struggling to regain upside momentum.
1-Hour – Sideways Grind After Breakdown

The 1H shows clean weakness:
* BOS downward
* Multiple failed retests of $182–183
* Price repeatedly rejecting the underside of the broken trendline
* Buyers only defending short-term at $176–178
The more NVDA keeps getting rejected at the same 1H resistance, the more pressure builds for a deeper dip.
Short-term 1H levels:
* Breakout: above $183 → retest $188–190
* Breakdown: below $176 → flush toward $172–170
1H tone → consolidation after rejection, leaning bearish unless buyers reclaim $183.
15-Minute – Compression Before the Next Move

The 15m chart is compressing inside a tight range after the clean BOS move earlier. This type of structure usually leads to an impulsive move.
The repeated rejection at $182–183 shows sellers defending aggressively. Buyers are only holding the short-term demand around $176–178.
15m tone → leaning bearish unless it breaks above $183 with real strength.
GEX – Options Positioning Shows the Real Pressure Points

On the NVDA GEX chart:
* Highest positive GEX: $185–187 → magnet + resistance
* 3rd CALL wall: near $190 → extension if momentum flips
* PUT walls:
* $172–175: heavy PUT support
* $160: large negative gamma zone
* $145–150: deep support if the market panics
What GEX is saying:
* Below $183, market makers lean bearish and push toward $176–172.
* A clean break above $185 can snap the chart upward into $188–190 fast due to positive gamma.
* A breakdown below $176 opens a straight path to $170–172 with momentum.
GEX aligns perfectly with the TA:
* All timeframes showing pressure from above
* GEX walls lining up with the exact levels on the 1H and 15m
* A bigger move waiting as soon as NVDA loses or reclaims the key areas
Trading Thoughts – Dec 1–5
Bullish Setup
NVDA needs a clean break + hold above $183–185.
Targets:
* Target 1: $188
* Target 2: $190 (CALL wall)
Stop zone → below $176
Call idea (only if breakout happens): NVDA 185C / 190C, short-dated — ONLY after confirmation.
Bearish Setup
If NVDA loses $176, downside opens quickly.
Targets:
* Target 1: $172
* Target 2: $170
* Target 3: $160 (deep support on GEX)
Put idea (safer): NVDA 172P or 170P — only valid if breakdown happens.
Overall Outlook for Dec 1–5
NVDA is sitting right at a squeeze point.
Key alignments:
* Weekly: losing momentum
* Daily: stuck under major supply
* 1H: rejecting underside of broken trendline
* 15m: compression before a direction
* GEX: clear resistance above $185 and clear support at $176 → perfect pressure map
The next move will be clean once direction confirms.
This is the type of setup where option traders shouldn’t guess — just wait for the breakout or breakdown and ride the move.
Disclaimer
This analysis is for educational purposes only, not financial advice. Always trade with proper risk management and confirmation.
NVDA has been riding a strong multi-month uptrend, but the last few weekly candles show the first real slowdown. A clear CHoCH formed near the recent highs, and sellers stepped in aggressively. The weekly candle closed with a long upper wick and a heavier body — signaling momentum cooling.
Important weekly zones:
* $198–200: previous weekly supply
* $176–178: weekly support where buyers stepped in
* $153–160: deeper weekly demand
* $120s: major demand if the market rolls over hard
Weekly tone → still bullish on the big structure, but fading momentum with the first signs of deeper pullback potential.
Daily – Inside a Pullback After Supply Rejection
Daily shows a sharp rejection from the supply zone near $210–215. Price broke structure downward (CHoCH), then bounced from a lower demand zone but hasn’t reclaimed the supply above.
Daily key levels:
* Resistance: $198 → $212
* Support: $177 → $172
Until price fully reclaims and holds above $198–200, NVDA stays at risk for lower continuation.
Daily tone → trapped underneath supply, struggling to regain upside momentum.
1-Hour – Sideways Grind After Breakdown
The 1H shows clean weakness:
* BOS downward
* Multiple failed retests of $182–183
* Price repeatedly rejecting the underside of the broken trendline
* Buyers only defending short-term at $176–178
The more NVDA keeps getting rejected at the same 1H resistance, the more pressure builds for a deeper dip.
Short-term 1H levels:
* Breakout: above $183 → retest $188–190
* Breakdown: below $176 → flush toward $172–170
1H tone → consolidation after rejection, leaning bearish unless buyers reclaim $183.
15-Minute – Compression Before the Next Move
The 15m chart is compressing inside a tight range after the clean BOS move earlier. This type of structure usually leads to an impulsive move.
The repeated rejection at $182–183 shows sellers defending aggressively. Buyers are only holding the short-term demand around $176–178.
15m tone → leaning bearish unless it breaks above $183 with real strength.
GEX – Options Positioning Shows the Real Pressure Points
On the NVDA GEX chart:
* Highest positive GEX: $185–187 → magnet + resistance
* 3rd CALL wall: near $190 → extension if momentum flips
* PUT walls:
* $172–175: heavy PUT support
* $160: large negative gamma zone
* $145–150: deep support if the market panics
What GEX is saying:
* Below $183, market makers lean bearish and push toward $176–172.
* A clean break above $185 can snap the chart upward into $188–190 fast due to positive gamma.
* A breakdown below $176 opens a straight path to $170–172 with momentum.
GEX aligns perfectly with the TA:
* All timeframes showing pressure from above
* GEX walls lining up with the exact levels on the 1H and 15m
* A bigger move waiting as soon as NVDA loses or reclaims the key areas
Trading Thoughts – Dec 1–5
Bullish Setup
NVDA needs a clean break + hold above $183–185.
Targets:
* Target 1: $188
* Target 2: $190 (CALL wall)
Stop zone → below $176
Call idea (only if breakout happens): NVDA 185C / 190C, short-dated — ONLY after confirmation.
Bearish Setup
If NVDA loses $176, downside opens quickly.
Targets:
* Target 1: $172
* Target 2: $170
* Target 3: $160 (deep support on GEX)
Put idea (safer): NVDA 172P or 170P — only valid if breakdown happens.
Overall Outlook for Dec 1–5
NVDA is sitting right at a squeeze point.
Key alignments:
* Weekly: losing momentum
* Daily: stuck under major supply
* 1H: rejecting underside of broken trendline
* 15m: compression before a direction
* GEX: clear resistance above $185 and clear support at $176 → perfect pressure map
The next move will be clean once direction confirms.
This is the type of setup where option traders shouldn’t guess — just wait for the breakout or breakdown and ride the move.
Disclaimer
This analysis is for educational purposes only, not financial advice. Always trade with proper risk management and confirmation.
Haftungsausschluss
Die Informationen und Veröffentlichungen sind nicht als Finanz-, Anlage-, Handels- oder andere Arten von Ratschlägen oder Empfehlungen gedacht, die von TradingView bereitgestellt oder gebilligt werden, und stellen diese nicht dar. Lesen Sie mehr in den Nutzungsbedingungen.
Haftungsausschluss
Die Informationen und Veröffentlichungen sind nicht als Finanz-, Anlage-, Handels- oder andere Arten von Ratschlägen oder Empfehlungen gedacht, die von TradingView bereitgestellt oder gebilligt werden, und stellen diese nicht dar. Lesen Sie mehr in den Nutzungsbedingungen.