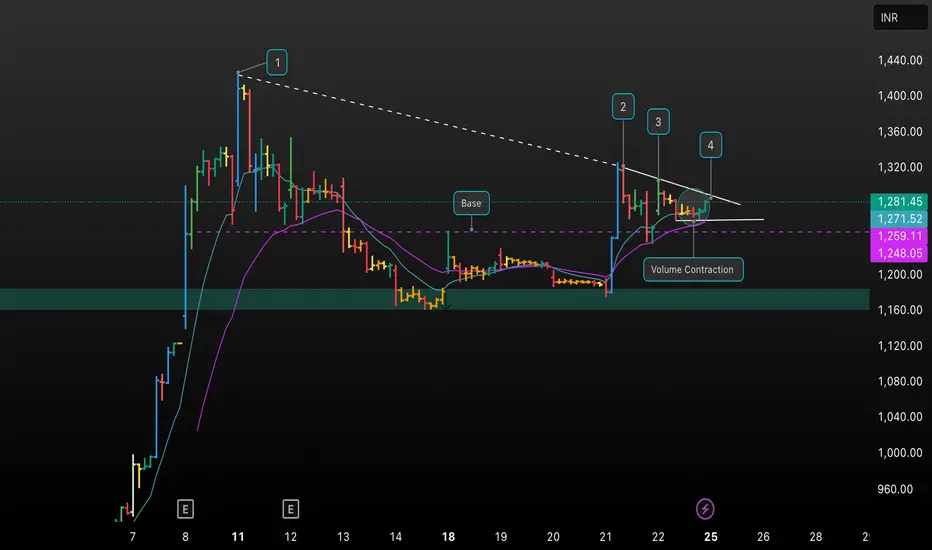
This chart showcases a detailed technical analysis of NSDL on the 45m timeframe, highlighting key price action zones, trendlines, and volume contraction patterns. I’ve marked the base formation, breakout attempts, and areas of interest using numbered points and indicator overlays. Notice the distinct volume contraction phase as price consolidates near resistance, potentially setting up a breakout. Key support/resistance levels and moving averages are also plotted.
Your feedback on this setup or alternative charting perspectives is welcome! Let’s discuss the probabilities and potential trade management for this breakout scenario.
This combination is clear, educational, and designed to invite discussion and engagement from traders and learners.
Your feedback on this setup or alternative charting perspectives is welcome! Let’s discuss the probabilities and potential trade management for this breakout scenario.
This combination is clear, educational, and designed to invite discussion and engagement from traders and learners.
Haftungsausschluss
Die Informationen und Veröffentlichungen sind nicht als Finanz-, Anlage-, Handels- oder andere Arten von Ratschlägen oder Empfehlungen gedacht, die von TradingView bereitgestellt oder gebilligt werden, und stellen diese nicht dar. Lesen Sie mehr in den Nutzungsbedingungen.
Haftungsausschluss
Die Informationen und Veröffentlichungen sind nicht als Finanz-, Anlage-, Handels- oder andere Arten von Ratschlägen oder Empfehlungen gedacht, die von TradingView bereitgestellt oder gebilligt werden, und stellen diese nicht dar. Lesen Sie mehr in den Nutzungsbedingungen.