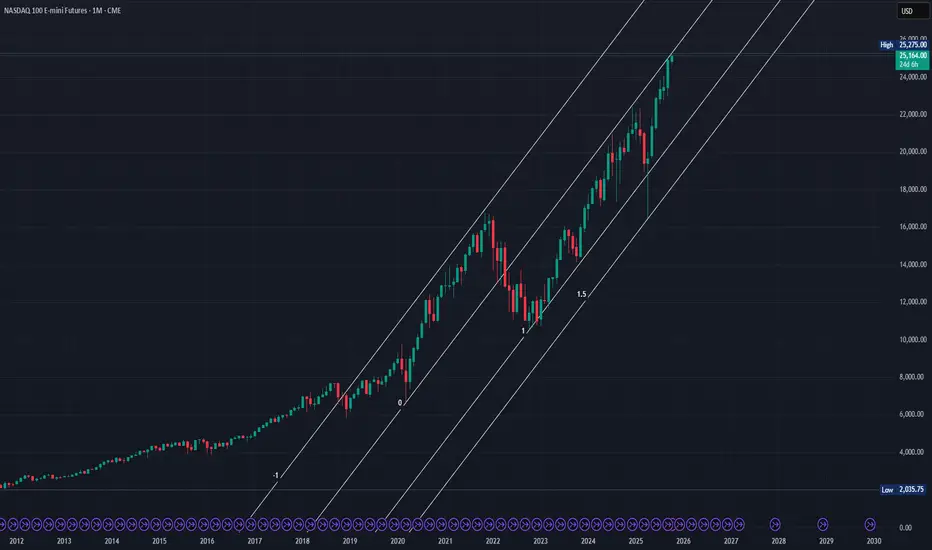
Here’s a breakdown of the current Nasdaq correction scenarios based on the Nasdaq Futures (NQ1!) chart.
Every time I reached the top of the channel, an adjustment came out.
Based on the monthly chart, it has closed positively for six consecutive months since the tariff reduction, and it is judged to have entered the overbought zone by breaking through the upper Bollinger Band.
While a Santa Rally could still occur in Q4, we expect a short-term correction within one to two weeks.
Your follow and boost would mean a lot. 🚀
I am Korean and I used Google Translate.
Haftungsausschluss
Die Informationen und Veröffentlichungen sind nicht als Finanz-, Anlage-, Handels- oder andere Arten von Ratschlägen oder Empfehlungen gedacht, die von TradingView bereitgestellt oder gebilligt werden, und stellen diese nicht dar. Lesen Sie mehr in den Nutzungsbedingungen.
Haftungsausschluss
Die Informationen und Veröffentlichungen sind nicht als Finanz-, Anlage-, Handels- oder andere Arten von Ratschlägen oder Empfehlungen gedacht, die von TradingView bereitgestellt oder gebilligt werden, und stellen diese nicht dar. Lesen Sie mehr in den Nutzungsbedingungen.
