🔹 NIFTY Trading Plan for 04-Nov-2025
(Based on psychological correction behavior and intraday structure)
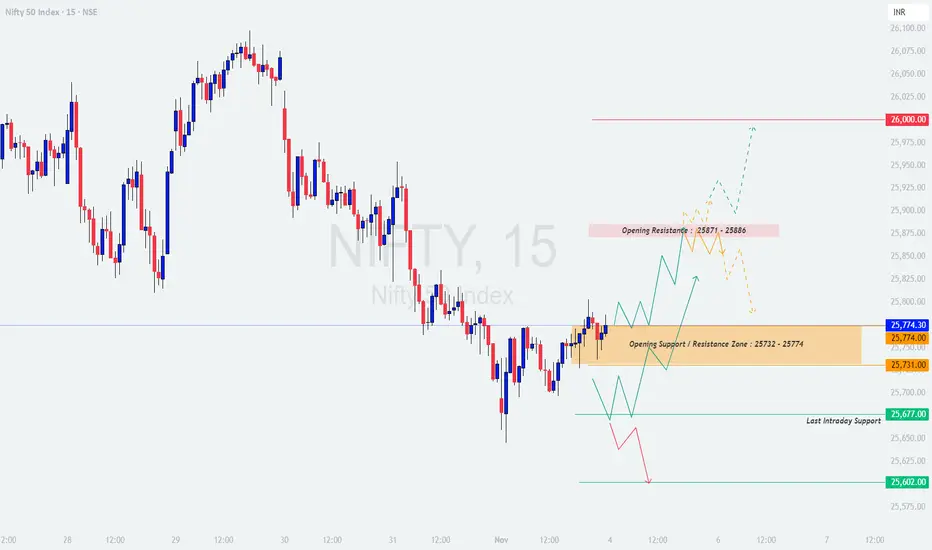
Chart Reference Levels:
🟧 Opening Support / Resistance Zone: 25,732 – 25,774
🟥 Opening Resistance: 25,871 – 25,886
🟩 Last Intraday Support: 25,677
🩵 Extended Support Zone: 25,602
❤️ Upside Psychological Target: 26,000
🟢 Scenario 1: Gap-Up Opening (100+ points above previous close)
📘 Educational Note: Gap-up days tend to trap retail traders who buy impulsively at the open. Always let the market prove its strength with a confirmed candle close before entering directional trades.
🟠 Scenario 2: Flat Opening (±50 points from previous close around 25,730)
📘 Educational Note: Flat openings allow clear structure formation — ideal for observing whether large players are accumulating or distributing. Avoid rushing; let trend direction confirm itself.
🔴 Scenario 3: Gap-Down Opening (100+ points below previous close)
📘 Educational Note: Gap-downs are emotional openings. Avoid panic selling; instead, analyze whether the drop is driven by emotion or genuine momentum. Patience during the first 15–30 minutes often saves capital and improves entries.
💡 Tips for Risk Management in Options Trading
📊 Summary & Conclusion:
In essence, 04-Nov-2025 could be a decision-making day for Nifty — either to confirm strength above the resistance band or to retest lower supports. Let the first 30 minutes establish the tone, then trade with discipline and risk control.
⚠️ Disclaimer:
I am not a SEBI-registered analyst. This analysis is shared purely for educational and informational purposes. Traders should conduct their own technical and psychological assessment or consult with a certified financial advisor before executing any trade.
(Based on psychological correction behavior and intraday structure)
Chart Reference Levels:
🟧 Opening Support / Resistance Zone: 25,732 – 25,774
🟥 Opening Resistance: 25,871 – 25,886
🟩 Last Intraday Support: 25,677
🩵 Extended Support Zone: 25,602
❤️ Upside Psychological Target: 26,000
🟢 Scenario 1: Gap-Up Opening (100+ points above previous close)
- [] If Nifty opens above 25,860, it enters near the Opening Resistance zone (25,871 – 25,886). Monitor how price behaves here — early candles showing rejection or long upper wicks could signal exhaustion and a potential pullback.
[] Only if Nifty sustains above 25,886 with strong momentum and closes a 15-minute candle above it, bulls could take control for a move towards the psychological mark of 26,000. - In case of a false breakout, prices could retrace back to the 25,774 zone, which may act as re-entry support for dip buyers.
📘 Educational Note: Gap-up days tend to trap retail traders who buy impulsively at the open. Always let the market prove its strength with a confirmed candle close before entering directional trades.
🟠 Scenario 2: Flat Opening (±50 points from previous close around 25,730)
- [] Flat openings near 25,732 – 25,774 indicate equilibrium between bulls and bears. The first half-hour will decide whether this zone acts as support or resistance.
[] If Nifty sustains above 25,774, it can climb towards 25,871, where sellers might emerge again. Watch for a decisive breakout or rejection at that level. - A breakdown below 25,732 would expose the index to 25,677 (Last Intraday Support). Sustained weakness below that level could extend toward 25,602.
📘 Educational Note: Flat openings allow clear structure formation — ideal for observing whether large players are accumulating or distributing. Avoid rushing; let trend direction confirm itself.
🔴 Scenario 3: Gap-Down Opening (100+ points below previous close)
- [] A gap-down below 25,650 brings price action directly near Last Intraday Support (25,677) or the Extended Support Zone (25,602). Watch closely for reversal candles or volume divergence in this region.
[] If Nifty fails to reclaim 25,677, it could extend weakness further, making 25,602 the next critical level where buyers may attempt to defend. - A recovery back above 25,732 after testing these supports may indicate a short-covering opportunity for intraday traders.
📘 Educational Note: Gap-downs are emotional openings. Avoid panic selling; instead, analyze whether the drop is driven by emotion or genuine momentum. Patience during the first 15–30 minutes often saves capital and improves entries.
💡 Tips for Risk Management in Options Trading
- [] Never risk more than 1–2% of total trading capital per position.
[] Use hourly candle close-based stop-losses to minimize whipsaws in volatile moves.
[] Avoid chasing far OTM options post 11:00 AM — theta decay accelerates quickly.
[] If implied volatility (IV) is high, prefer spreads (Bull Call / Bear Put) over naked options. - Always pre-define your exit plan — entry is optional, exit is mandatory.
📊 Summary & Conclusion:
- [] Above 25,886 → Bulls likely to extend toward 26,000.
[] Between 25,732 – 25,774 → Neutral consolidation zone; trade cautiously. - Below 25,677 → Bearish bias may continue toward 25,602.
In essence, 04-Nov-2025 could be a decision-making day for Nifty — either to confirm strength above the resistance band or to retest lower supports. Let the first 30 minutes establish the tone, then trade with discipline and risk control.
⚠️ Disclaimer:
I am not a SEBI-registered analyst. This analysis is shared purely for educational and informational purposes. Traders should conduct their own technical and psychological assessment or consult with a certified financial advisor before executing any trade.
Haftungsausschluss
Die Informationen und Veröffentlichungen sind nicht als Finanz-, Anlage-, Handels- oder andere Arten von Ratschlägen oder Empfehlungen gedacht, die von TradingView bereitgestellt oder gebilligt werden, und stellen diese nicht dar. Lesen Sie mehr in den Nutzungsbedingungen.
Haftungsausschluss
Die Informationen und Veröffentlichungen sind nicht als Finanz-, Anlage-, Handels- oder andere Arten von Ratschlägen oder Empfehlungen gedacht, die von TradingView bereitgestellt oder gebilligt werden, und stellen diese nicht dar. Lesen Sie mehr in den Nutzungsbedingungen.