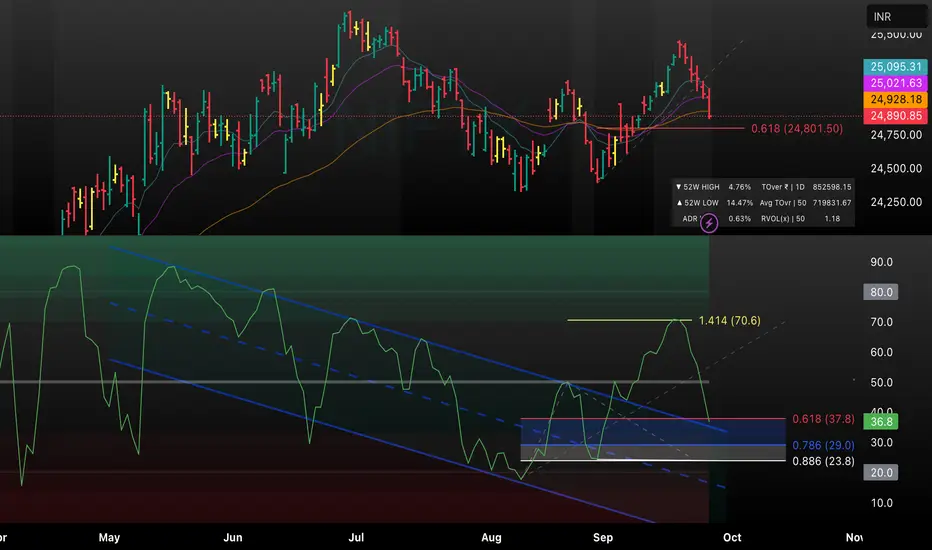
This chart combines price action with key Fibonacci retracement and extension levels to anticipate potential support or reversal zones. Price is currently testing the crucial 0.618 retracement (24,801.50) after a notable downward move. RSI is also reacting near its own significant levels, aligning with both 0.618 on the downside (37.8) and the 1.414 extension (70.6) on the upside. Watch for reactions at these levels for clues on whether price will bounce or continue to the next fib zone, especially with momentum indicators confirming support/resistance confluence.
Haftungsausschluss
Die Informationen und Veröffentlichungen sind nicht als Finanz-, Anlage-, Handels- oder andere Arten von Ratschlägen oder Empfehlungen gedacht, die von TradingView bereitgestellt oder gebilligt werden, und stellen diese nicht dar. Lesen Sie mehr in den Nutzungsbedingungen.
Haftungsausschluss
Die Informationen und Veröffentlichungen sind nicht als Finanz-, Anlage-, Handels- oder andere Arten von Ratschlägen oder Empfehlungen gedacht, die von TradingView bereitgestellt oder gebilligt werden, und stellen diese nicht dar. Lesen Sie mehr in den Nutzungsbedingungen.