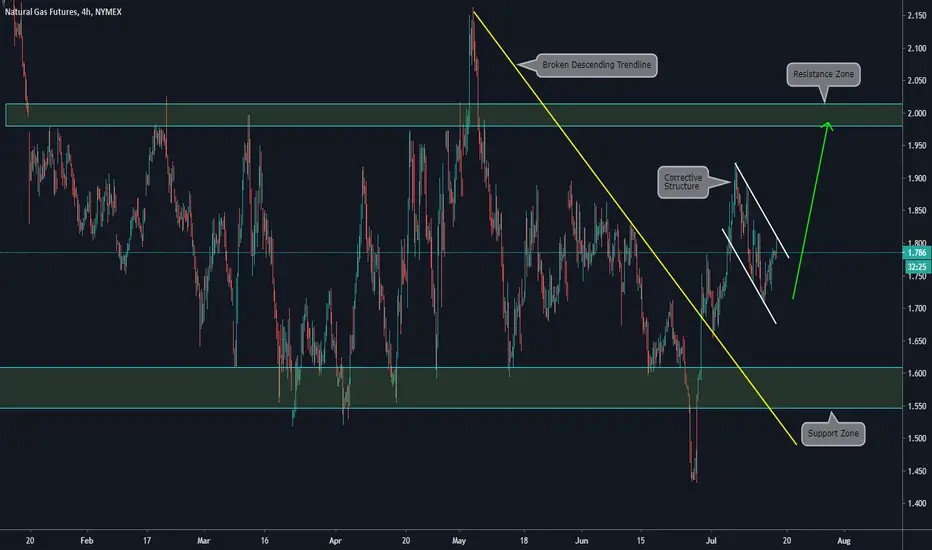
Main items we can see on the chart:
a) The price is inside a clear range, between a support and a resistance zone
b) Inside the range, we can see a broken descending trendline after the price bounced on the support zone
c) After the breakout, we can see a corrective Structure
d) If the Corrective Structure is broken we expect a continuation of the bullish movement, towards the next resistance zone
Haftungsausschluss
Die Informationen und Veröffentlichungen sind nicht als Finanz-, Anlage-, Handels- oder andere Arten von Ratschlägen oder Empfehlungen gedacht, die von TradingView bereitgestellt oder gebilligt werden, und stellen diese nicht dar. Lesen Sie mehr in den Nutzungsbedingungen.
Haftungsausschluss
Die Informationen und Veröffentlichungen sind nicht als Finanz-, Anlage-, Handels- oder andere Arten von Ratschlägen oder Empfehlungen gedacht, die von TradingView bereitgestellt oder gebilligt werden, und stellen diese nicht dar. Lesen Sie mehr in den Nutzungsbedingungen.