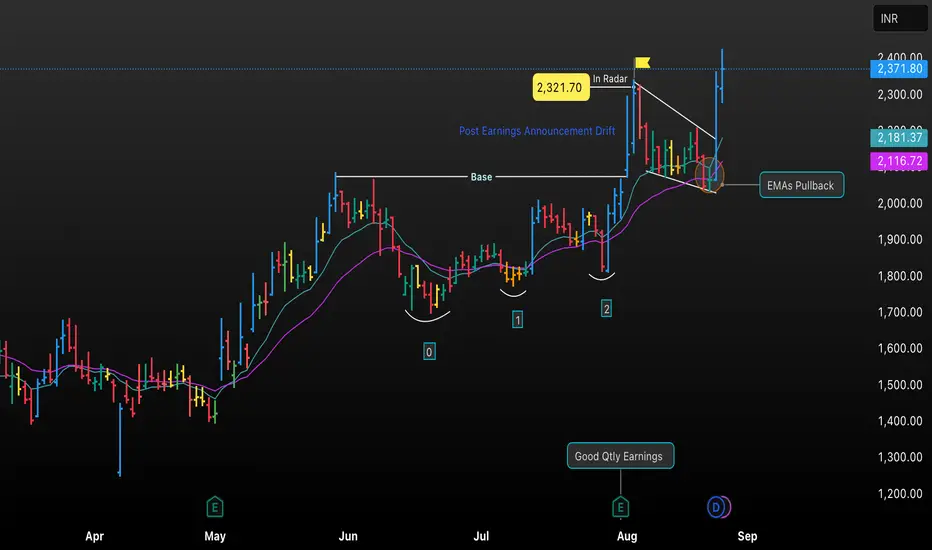
• This chart analyzes NETWEB’s price movement after a favorable quarterly earnings announcement, highlighting post-earnings drift, the formation of a trend base, and recent EMA pullback.
• Key annotations include buy signals, reaction levels, and actionable price zones to help identify optimal entry and exit opportunities for swing and positional trades.
• Clearly marked support and resistance, along with EMA overlays, provide a transparent ‘radar’ for traders to visualize how earnings and technical patterns interact.
Haftungsausschluss
Die Informationen und Veröffentlichungen sind nicht als Finanz-, Anlage-, Handels- oder andere Arten von Ratschlägen oder Empfehlungen gedacht, die von TradingView bereitgestellt oder gebilligt werden, und stellen diese nicht dar. Lesen Sie mehr in den Nutzungsbedingungen.
Haftungsausschluss
Die Informationen und Veröffentlichungen sind nicht als Finanz-, Anlage-, Handels- oder andere Arten von Ratschlägen oder Empfehlungen gedacht, die von TradingView bereitgestellt oder gebilligt werden, und stellen diese nicht dar. Lesen Sie mehr in den Nutzungsbedingungen.