📈 Chart Pattern: Bearish Harmonic (Possibly Bearish Bat or Gartley Variant)
⚠️ Price Structure Breakdown:
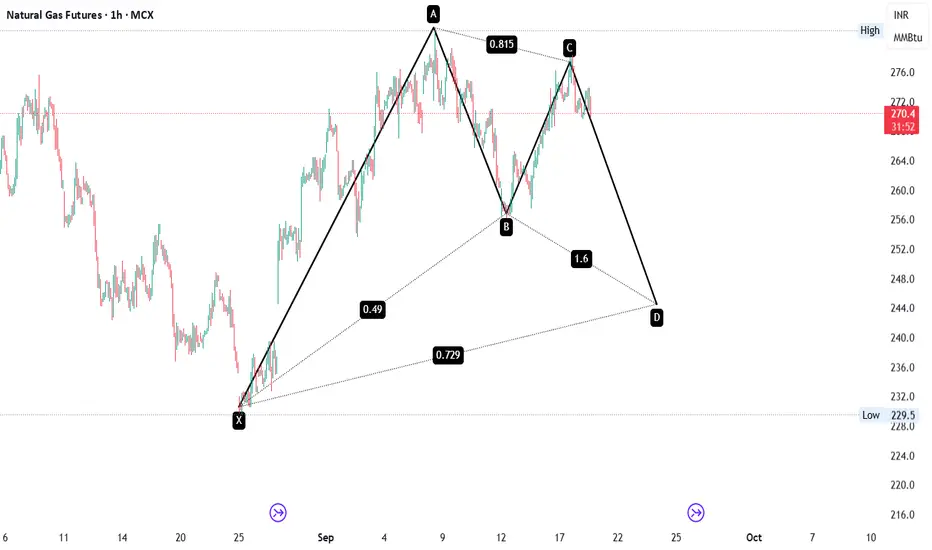
A clean XABCD Harmonic Pattern is visible on the 1H timeframe:
🔹 XA Leg: Sharp impulsive rally from ₹229 → ₹281
🔹 AB Leg: Pullback retraced 49% of XA
🔹 BC Leg: Strong recovery to 81.5% of AB
🔹 CD Projection: 1.6x extension of BC, projecting a potential D point near ₹244–248 zone
📌 Key Technical Highlights:
✅ Pattern in play: Bearish harmonic indicating upcoming correction phase
🧲 D target zone aligns with previous demand cluster from late August
🔄 Ideal reversal zone between ₹244–248 (Watch for price-action confirmation near D)
🎯 Possible Trade Setup (Anticipated Post Completion at Point D):
📉 Sell NG Futures near ₹244–248 (on reversal confirmation)
🎯 Targets: ₹234 → ₹229
🛑 SL: Above ₹251 (on closing basis)
🧠 Why This Matters:
Harmonic patterns like this, especially with clean Fibonacci alignment, often mark high-probability reversal zones. Combined with volume + divergence filters, this zone could provide a lucrative swing trade setup.
Haftungsausschluss
Die Informationen und Veröffentlichungen sind nicht als Finanz-, Anlage-, Handels- oder andere Arten von Ratschlägen oder Empfehlungen gedacht, die von TradingView bereitgestellt oder gebilligt werden, und stellen diese nicht dar. Lesen Sie mehr in den Nutzungsbedingungen.
Haftungsausschluss
Die Informationen und Veröffentlichungen sind nicht als Finanz-, Anlage-, Handels- oder andere Arten von Ratschlägen oder Empfehlungen gedacht, die von TradingView bereitgestellt oder gebilligt werden, und stellen diese nicht dar. Lesen Sie mehr in den Nutzungsbedingungen.