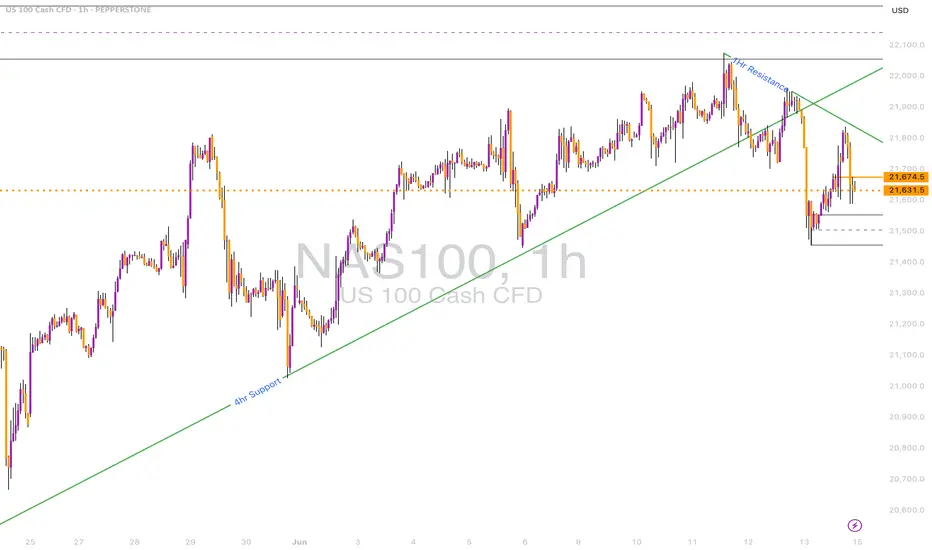
Price is reacting from the 1D resistance zone around 21,950 and now hovering near a 4H support zone at ~21,520.
• 1D Chart: Long wick rejection from resistance.
• 4H Chart: Break of rising wedge and rejection from 1H trendline.
• 1H & 23m Chart: Clear bearish order block formed. Price consolidating under broken structure.
Key Zones:
• Support: 21,500 / 21,325
• Resistance: 21,900 / 22,000
Bias: Bearish below 21,750. Retest of support expected.
Haftungsausschluss
Die Informationen und Veröffentlichungen sind nicht als Finanz-, Anlage-, Handels- oder andere Arten von Ratschlägen oder Empfehlungen gedacht, die von TradingView bereitgestellt oder gebilligt werden, und stellen diese nicht dar. Lesen Sie mehr in den Nutzungsbedingungen.
Haftungsausschluss
Die Informationen und Veröffentlichungen sind nicht als Finanz-, Anlage-, Handels- oder andere Arten von Ratschlägen oder Empfehlungen gedacht, die von TradingView bereitgestellt oder gebilligt werden, und stellen diese nicht dar. Lesen Sie mehr in den Nutzungsbedingungen.