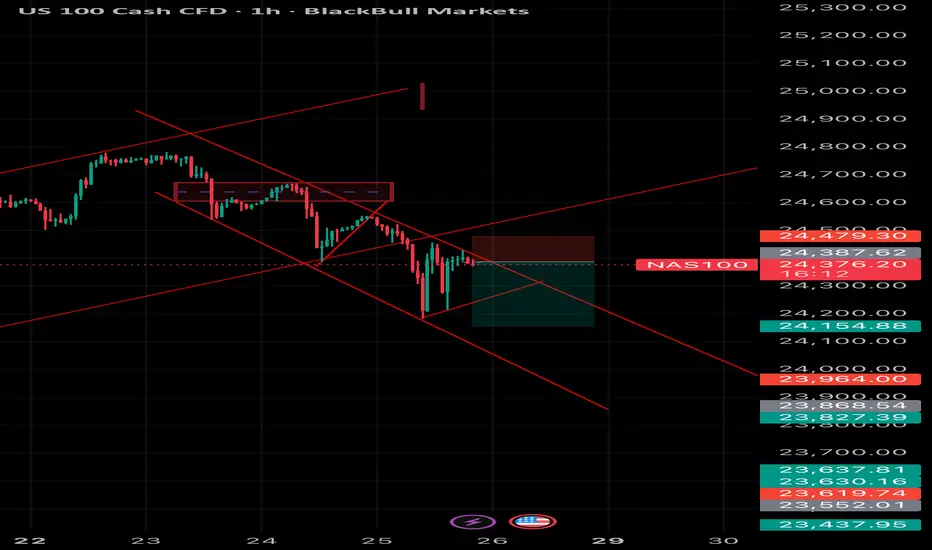
📉 NAS100 Technical Analysis (1H Chart)
NAS100 is trading around 24,374 and continues to respect a strong descending channel, signaling bearish momentum.
• Trend: Price rejected the previous supply zone (24,470 – 24,500) and failed to break above resistance, confirming sellers are still in control.
• Entry Zone: The retest of broken support turned resistance around 24,387 – 24,479 shows bearish rejection with downside continuation likely.
• Target Levels:
• First target: 24,154 (mid-channel support)
• Next target zone: 23,960 – 23,827 (lower channel support)
• Invalidation: A clean 1H close above 24,500 would invalidate this bearish structure and could trigger a corrective move higher.
👉 Short-term bias remains bearish while under 24,500 with room for continuation toward 24,150 – 23,900.
Haftungsausschluss
Die Informationen und Veröffentlichungen sind nicht als Finanz-, Anlage-, Handels- oder andere Arten von Ratschlägen oder Empfehlungen gedacht, die von TradingView bereitgestellt oder gebilligt werden, und stellen diese nicht dar. Lesen Sie mehr in den Nutzungsbedingungen.
Haftungsausschluss
Die Informationen und Veröffentlichungen sind nicht als Finanz-, Anlage-, Handels- oder andere Arten von Ratschlägen oder Empfehlungen gedacht, die von TradingView bereitgestellt oder gebilligt werden, und stellen diese nicht dar. Lesen Sie mehr in den Nutzungsbedingungen.