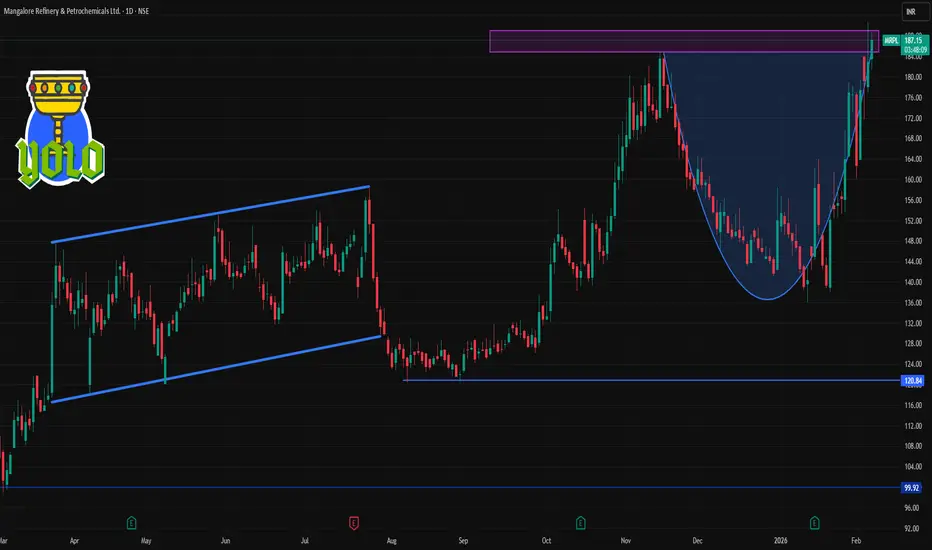
📊 Latest Price Context (daily):
• The stock has recently been trading around ₹184–188 on NSE/BSE on the current session.
⭐ Daily Pivot Levels (Classic / Standard)
(used by many traders for intraday bias)
Level ₹ Price
R3 (Upper resistance) ~197.27
R2 ~190.63
R1 (Immediate resistance) ~184.97
Pivot Point (PP) ~178.33
S1 (Immediate support) ~172.67
S2 ~166.03
S3 ~160.37
👉 Interpretation:
Above Pivot (178–180) → bullish bias intraday.
Below Pivot → bearish / correction bias.
Resistance clusters near 185–191, with strong upper resistance around 197.
Immediate supports around 173 and 166 zones.
🔁 Alternate Daily Levels (Trendlyne)
(corroborated by another pivot source)
R1: ~₹185
R2: ~₹191
S1: ~₹172
S2: ~₹171 / ~₹168 (minor)
👉 Very similar structure: range ~172–185 for the day, with next larger moves beyond these points.
📌 Short Summary for 1-Day Trading Bias
Bullish if:
MRPL holds above daily pivot ~178–180
Break / close above ~185 could trigger further upside toward ~190–197
Bearish if:
Break below ~172 support
Next support zones: ~166 → ~160 area
Verbundene Veröffentlichungen
Haftungsausschluss
Die Informationen und Veröffentlichungen sind nicht als Finanz-, Anlage-, Handels- oder andere Arten von Ratschlägen oder Empfehlungen gedacht, die von TradingView bereitgestellt oder gebilligt werden, und stellen diese nicht dar. Lesen Sie mehr in den Nutzungsbedingungen.