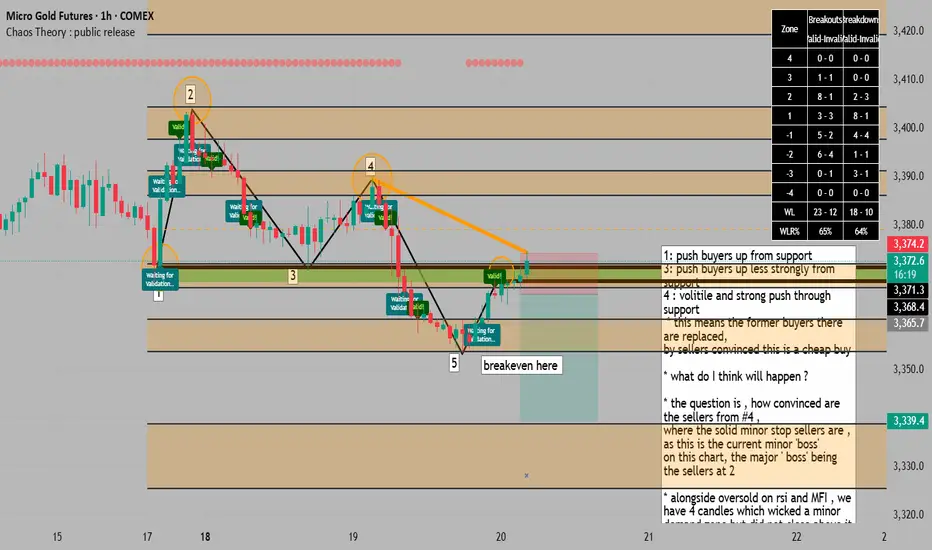
1: push buyers up from support
3: push buyers up less strongly from support
4 : volitile and strong push through support
* this means the former buyers there are replaced,
by sellers convinced this is a cheap buy
* what do I think will happen ?
* the question is , how convinced are the sellers from #4 ,
where the solid minor stop sellers are , as this is the current minor 'boss'
on this chart, the major ' boss' being the sellers at 2
* alongside oversold on rsi and MFI , we have 4 candles which wicked a minor demand zone but did not close above it
* we also have hidden divergence on the MFI and RSI adding to a sell confluence.
* in my opinion its enough to get us to a 1:1, maybe breakeven and go for a larger target
* according to chaos theory indicator zones,
over the past 2,500 candles, when price closes below a zone, it has a 66% chance of reaching the next zone below, a low below the current candle then prsents a good entry, with a target at the zone below and a good breakeven point when price enters the second travel zone below ( 66% chance we will travel from a orange zone to the next )
* another interesting detail is that when we add horizontal resistance lines from the peak of the rsi and mfi, it co-incides with price peaks, and predicts the next downturn to be here as well.
Order storniert
all my paid ( pro ) scripts can be obtained for a low price of 19.99 / month at : whop.com/sabr-pro-tools/access-to-all-pro-tools/
Haftungsausschluss
Die Informationen und Veröffentlichungen sind nicht als Finanz-, Anlage-, Handels- oder andere Arten von Ratschlägen oder Empfehlungen gedacht, die von TradingView bereitgestellt oder gebilligt werden, und stellen diese nicht dar. Lesen Sie mehr in den Nutzungsbedingungen.