# The 2-Sigma Rejection: Gold's Multi-Indicator Reversal Blueprint
## Market Structure Evolution (Points 1→4)
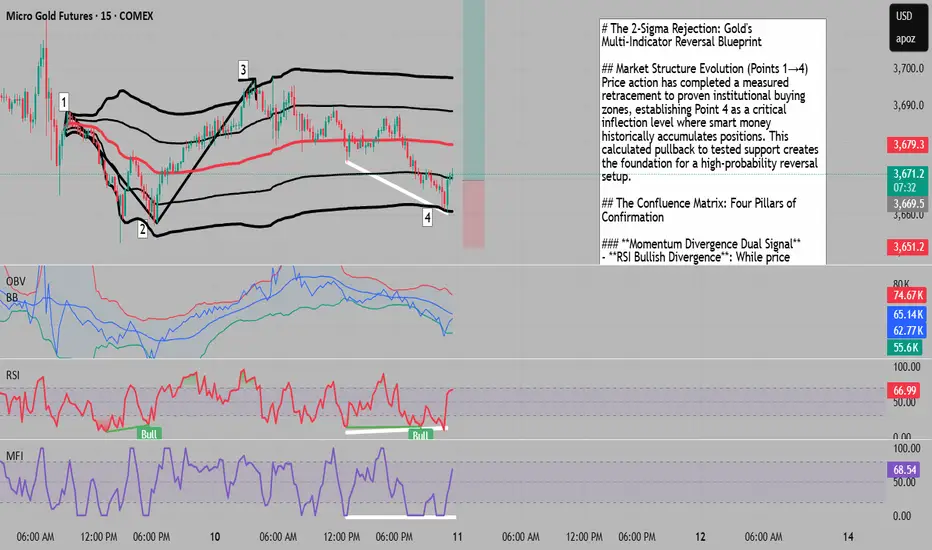
Price action has completed a measured retracement to proven institutional buying zones, establishing Point 4 as a critical inflection level where smart money historically accumulates positions. This calculated pullback to tested support creates the foundation for a high-probability reversal setup.
## The Confluence Matrix: Four Pillars of Confirmation
### **Momentum Divergence Dual Signal**
- **RSI Bullish Divergence**: While price printed a lower low at Point 4, the Relative Strength Index formed a higher low, revealing underlying strength masked by price action
- **MFI Confirmation**: Money Flow Index mirrors the RSI divergence, indicating that capital flows are diverging positively from price - a signature of accumulation during apparent weakness
### **Bollinger Band Extremity Alignment**
- **Price at Lower Band**: Point 4 precisely tags the lower Bollinger Band, marking a statistically significant oversold extreme
- **OBV Breaking Below Its Lower Band**: A rare occurrence where On-Balance Volume pierces below its own Bollinger Band lower boundary - historically a powerful mean reversion signal that suggests panic selling into strong hands
### **The 2-Standard Deviation Rejection**
Using Point 1 as the VWAP anchor creates a statistically robust framework:
- Point 4 achieves a perfect touch and rejection from the 2nd standard deviation below VWAP
- This represents a 95% statistical extreme, where price typically finds aggressive buyers
- The rejection from this level confirms institutional algorithms are defending this mathematically significant zone
## Technical Synthesis
This setup presents a textbook convergence of statistical extremes and momentum divergences. The simultaneous occurrence of:
- Dual momentum divergences (RSI + MFI)
- Dual Bollinger Band extremes (Price + OBV)
- 2-sigma VWAP deviation test
Creates a rare "perfect storm" reversal setup where multiple independent indicators reach oversold extremes simultaneously.
## Probability Assessment
When price touches the lower Bollinger Band while OBV breaks below its own band, historical data suggests a >70% probability of mean reversion within 5-10 bars. Combined with the momentum divergences and VWAP deviation test, this creates an asymmetric risk-reward scenario favoring long positions.
## Risk Management Framework
- **Stop Loss**: Below Point 4 with buffer for volatility
- **Initial Target**: VWAP mean reversion (1st standard deviation)
- **Extended Target**: Upper Bollinger Band or Point 3 resistance
- **Invalidation**: Sustained break below 2nd VWAP deviation would negate the setup
## Key Takeaway
The convergence of statistical extremes across multiple non-correlated indicators at Point 4 creates a institutional-grade reversal setup. The 2-sigma VWAP rejection, combined with rare OBV Bollinger Band penetration and dual momentum divergences, presents a compelling mean reversion opportunity with clearly defined risk parameters.
## Market Structure Evolution (Points 1→4)
Price action has completed a measured retracement to proven institutional buying zones, establishing Point 4 as a critical inflection level where smart money historically accumulates positions. This calculated pullback to tested support creates the foundation for a high-probability reversal setup.
## The Confluence Matrix: Four Pillars of Confirmation
### **Momentum Divergence Dual Signal**
- **RSI Bullish Divergence**: While price printed a lower low at Point 4, the Relative Strength Index formed a higher low, revealing underlying strength masked by price action
- **MFI Confirmation**: Money Flow Index mirrors the RSI divergence, indicating that capital flows are diverging positively from price - a signature of accumulation during apparent weakness
### **Bollinger Band Extremity Alignment**
- **Price at Lower Band**: Point 4 precisely tags the lower Bollinger Band, marking a statistically significant oversold extreme
- **OBV Breaking Below Its Lower Band**: A rare occurrence where On-Balance Volume pierces below its own Bollinger Band lower boundary - historically a powerful mean reversion signal that suggests panic selling into strong hands
### **The 2-Standard Deviation Rejection**
Using Point 1 as the VWAP anchor creates a statistically robust framework:
- Point 4 achieves a perfect touch and rejection from the 2nd standard deviation below VWAP
- This represents a 95% statistical extreme, where price typically finds aggressive buyers
- The rejection from this level confirms institutional algorithms are defending this mathematically significant zone
## Technical Synthesis
This setup presents a textbook convergence of statistical extremes and momentum divergences. The simultaneous occurrence of:
- Dual momentum divergences (RSI + MFI)
- Dual Bollinger Band extremes (Price + OBV)
- 2-sigma VWAP deviation test
Creates a rare "perfect storm" reversal setup where multiple independent indicators reach oversold extremes simultaneously.
## Probability Assessment
When price touches the lower Bollinger Band while OBV breaks below its own band, historical data suggests a >70% probability of mean reversion within 5-10 bars. Combined with the momentum divergences and VWAP deviation test, this creates an asymmetric risk-reward scenario favoring long positions.
## Risk Management Framework
- **Stop Loss**: Below Point 4 with buffer for volatility
- **Initial Target**: VWAP mean reversion (1st standard deviation)
- **Extended Target**: Upper Bollinger Band or Point 3 resistance
- **Invalidation**: Sustained break below 2nd VWAP deviation would negate the setup
## Key Takeaway
The convergence of statistical extremes across multiple non-correlated indicators at Point 4 creates a institutional-grade reversal setup. The 2-sigma VWAP rejection, combined with rare OBV Bollinger Band penetration and dual momentum divergences, presents a compelling mean reversion opportunity with clearly defined risk parameters.
Haftungsausschluss
Die Informationen und Veröffentlichungen sind nicht als Finanz-, Anlage-, Handels- oder andere Arten von Ratschlägen oder Empfehlungen gedacht, die von TradingView bereitgestellt oder gebilligt werden, und stellen diese nicht dar. Lesen Sie mehr in den Nutzungsbedingungen.
Haftungsausschluss
Die Informationen und Veröffentlichungen sind nicht als Finanz-, Anlage-, Handels- oder andere Arten von Ratschlägen oder Empfehlungen gedacht, die von TradingView bereitgestellt oder gebilligt werden, und stellen diese nicht dar. Lesen Sie mehr in den Nutzungsbedingungen.