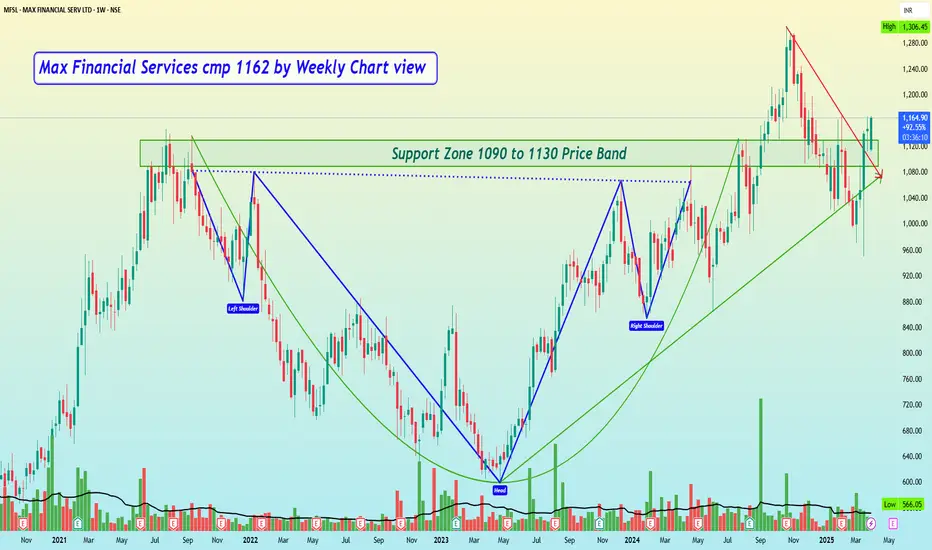
Max Financial Services cmp 1162 by Weekly Chart view
- Support Zone 1090 to 1130 Price Band
- Resistance Zone 1200 to 1245 Price Band
- Volumes getting in close sync with average traded quantity indicating demand based buying
- Price respecting Rising Support Trendline and sustaining Breakout above Falling Resistance Trendline
- Support is going thru the test and retesting phase with a faint breakout in the making process seen clearly
- Multiple intertwined Bullish Patterns of Rounding Bottom, Cup & Handle, Head & Shoulders, as one may observe and interpret
Haftungsausschluss
Die Informationen und Veröffentlichungen sind nicht als Finanz-, Anlage-, Handels- oder andere Arten von Ratschlägen oder Empfehlungen gedacht, die von TradingView bereitgestellt oder gebilligt werden, und stellen diese nicht dar. Lesen Sie mehr in den Nutzungsbedingungen.
Haftungsausschluss
Die Informationen und Veröffentlichungen sind nicht als Finanz-, Anlage-, Handels- oder andere Arten von Ratschlägen oder Empfehlungen gedacht, die von TradingView bereitgestellt oder gebilligt werden, und stellen diese nicht dar. Lesen Sie mehr in den Nutzungsbedingungen.