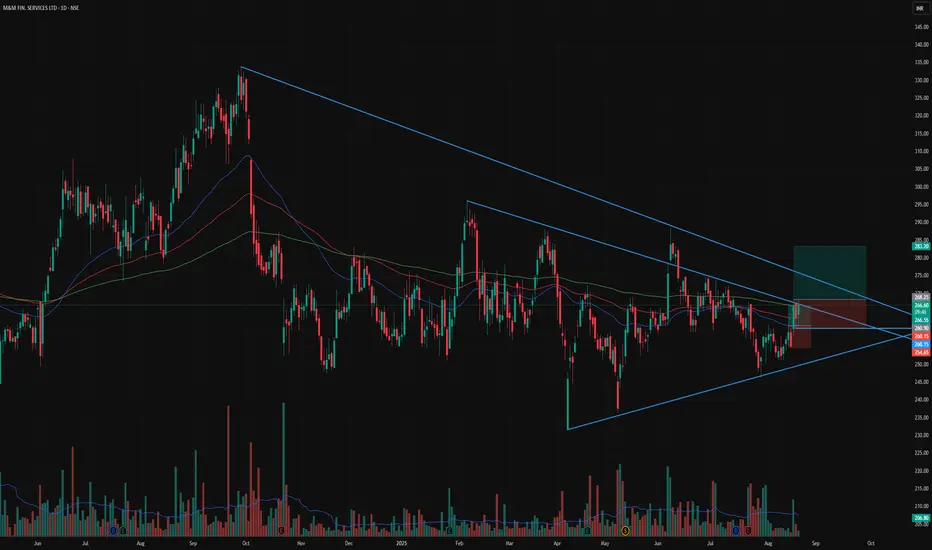
📊 Stock: M&M Financial Services (M&MFIN)
🔹 Symmetrical triangle pattern forming – price squeezing into apex
🔹 Strong bounce from lower trendline with rising volume
🔹 Trading above 50 DMA & 100 DMA – short-term trend improving
🔹 200 DMA resistance near ₹268–270 being tested
🔹 RSI showing strength
🔹 Good support zone at ₹250–255
🔹 Strong financial backing as part of M&M Group
⚡ Price nearing breakout zone (₹268–270)
🚀 Breakout above 268 can trigger a rally towards ₹283–300
⚠️ Support at ₹250 – below this trend may weaken
Haftungsausschluss
Die Informationen und Veröffentlichungen sind nicht als Finanz-, Anlage-, Handels- oder andere Arten von Ratschlägen oder Empfehlungen gedacht, die von TradingView bereitgestellt oder gebilligt werden, und stellen diese nicht dar. Lesen Sie mehr in den Nutzungsbedingungen.
Haftungsausschluss
Die Informationen und Veröffentlichungen sind nicht als Finanz-, Anlage-, Handels- oder andere Arten von Ratschlägen oder Empfehlungen gedacht, die von TradingView bereitgestellt oder gebilligt werden, und stellen diese nicht dar. Lesen Sie mehr in den Nutzungsbedingungen.