KSM 1W chart has a Desending tringle pattern that has been broke
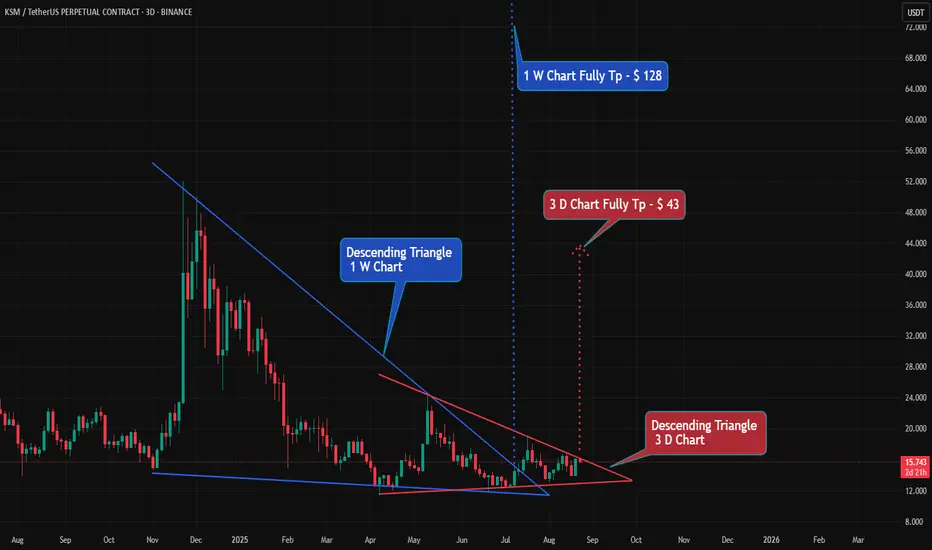
#KSM 1W chart has a Desending tringle pattern that has been broken. 🔼🔼
#KMS Coin is currently forming a Descending Triangle pattern on the 3D chart.
👀 When the market reaches the $723 level, 👀 it shows a double bottom pattern. If it also breaks out, it can rise to $1060.🔼
💵 Tp 1 : $ 443
💵 Tp 2 : $ 499
💵 Tp 3 : $ 575
💵 Tp 4 : $ 723
💵 Tp 5 : $ 1060
#KMS Coin is currently forming a Descending Triangle pattern on the 3D chart.
👀 When the market reaches the $723 level, 👀 it shows a double bottom pattern. If it also breaks out, it can rise to $1060.🔼
💵 Tp 1 : $ 443
💵 Tp 2 : $ 499
💵 Tp 3 : $ 575
💵 Tp 4 : $ 723
💵 Tp 5 : $ 1060
Haftungsausschluss
Die Informationen und Veröffentlichungen sind nicht als Finanz-, Anlage-, Handels- oder andere Arten von Ratschlägen oder Empfehlungen gedacht, die von TradingView bereitgestellt oder gebilligt werden, und stellen diese nicht dar. Lesen Sie mehr in den Nutzungsbedingungen.
Haftungsausschluss
Die Informationen und Veröffentlichungen sind nicht als Finanz-, Anlage-, Handels- oder andere Arten von Ratschlägen oder Empfehlungen gedacht, die von TradingView bereitgestellt oder gebilligt werden, und stellen diese nicht dar. Lesen Sie mehr in den Nutzungsbedingungen.