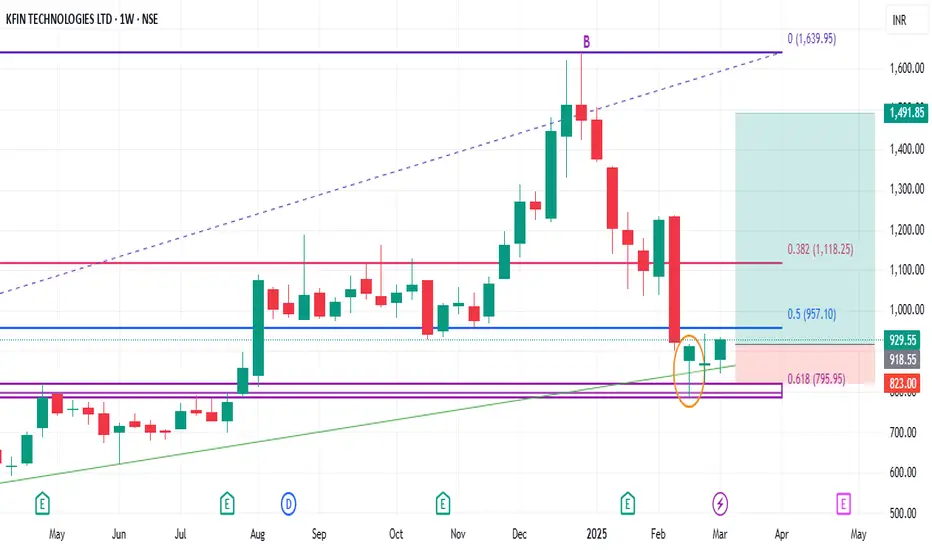
Go Long @ 918.55 for Targets of 1109.65, 1205.2, 1300.75, and 1491.85 with SL 439.15
Reasons to go Long :
1. On a Weekly timeframe if we draw the Fibonacci retracement tool from the recent swing low (point A) to the recent swing high (point B) then we see stock took support from the 0.618 Fibonacci level.
2. Besides, a bullish candlestick pattern Bullish Hammer (marked with orange) is formed around the 0.618 Fibonacci level.
3. In addition to this there is a strong demand zone (marked with purple) which earlier was acting like resistance but now is providing support to the stock.
4. There is also a strong Trendline (marked with green) that is providing support to the stock.
Trade ist aktiv
Trade geschlossen: Ziel wurde erreicht
Target 1 AchievedAnmerkung
Targets 2 & 3 achievedHaftungsausschluss
Die Informationen und Veröffentlichungen sind nicht als Finanz-, Anlage-, Handels- oder andere Arten von Ratschlägen oder Empfehlungen gedacht, die von TradingView bereitgestellt oder gebilligt werden, und stellen diese nicht dar. Lesen Sie mehr in den Nutzungsbedingungen.
Haftungsausschluss
Die Informationen und Veröffentlichungen sind nicht als Finanz-, Anlage-, Handels- oder andere Arten von Ratschlägen oder Empfehlungen gedacht, die von TradingView bereitgestellt oder gebilligt werden, und stellen diese nicht dar. Lesen Sie mehr in den Nutzungsbedingungen.