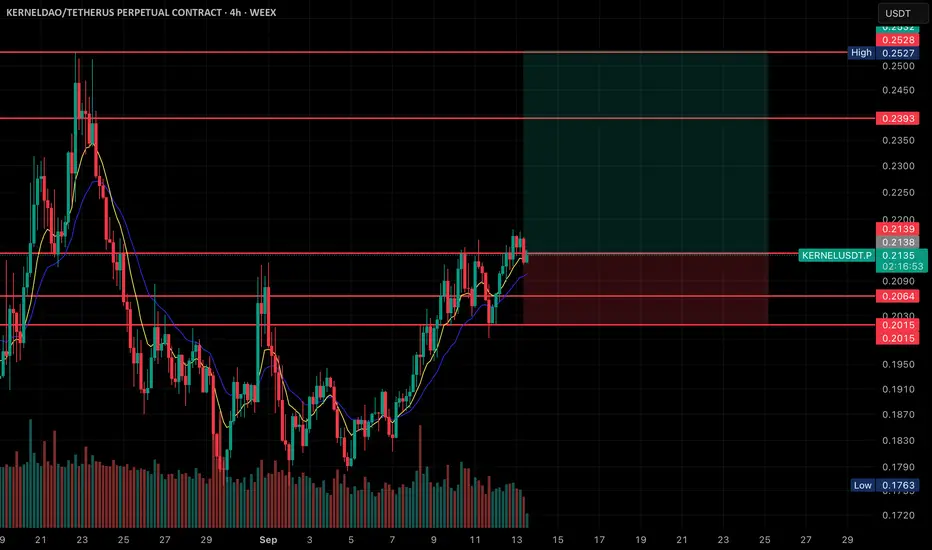
• Pair/Timeframe: KERNELDAO/USDT Perpetual Contract, 4H chart (WEEX).
• Current Price: ~0.2133 USDT (slightly down −0.79%).
⸻
🔹 Market Structure:
• The price has been in a steady uptrend since early September, forming higher lows and pushing into resistance.
• Current movement shows consolidation near the 0.2139 zone, which was a previous resistance now acting as support.
⸻
🔹 Trade Setup (Highlighted Box):
• Entry Zone: Around 0.2133 – 0.2139.
• Stop-Loss: Below support levels, around 0.2040 – 0.2015.
• Target (Take-Profit): ~0.2393 – 0.2527, with the upper resistance being the main target.
• Risk-to-Reward: Favorable setup, as the potential upside is significantly higher than the defined downside.
⸻
🔹 Key Levels:
• Resistance Levels:
• 0.2139 (current breakout retest zone)
• 0.2393 (major resistance)
• 0.2527 (upper resistance / target area)
• Support Levels:
• 0.2064 (first support)
• 0.2040 (secondary support)
• 0.2015 (stop-loss zone)
• 0.1763 (major swing low)
⸻
🔹 Indicators:
• Moving averages (short-term) are aligned upward, supporting bullish continuation.
• Volume shows increased activity during the recent breakout, adding strength to the trend.
⸻
📈 Summary: The chart is showing a bullish continuation setup. As long as price holds above 0.2139 support, it has potential to rally toward 0.2393 – 0.2527. The stop-loss is well protected below 0.2040 – 0.2015.
Haftungsausschluss
Die Informationen und Veröffentlichungen sind nicht als Finanz-, Anlage-, Handels- oder andere Arten von Ratschlägen oder Empfehlungen gedacht, die von TradingView bereitgestellt oder gebilligt werden, und stellen diese nicht dar. Lesen Sie mehr in den Nutzungsbedingungen.
Haftungsausschluss
Die Informationen und Veröffentlichungen sind nicht als Finanz-, Anlage-, Handels- oder andere Arten von Ratschlägen oder Empfehlungen gedacht, die von TradingView bereitgestellt oder gebilligt werden, und stellen diese nicht dar. Lesen Sie mehr in den Nutzungsbedingungen.