Price Action
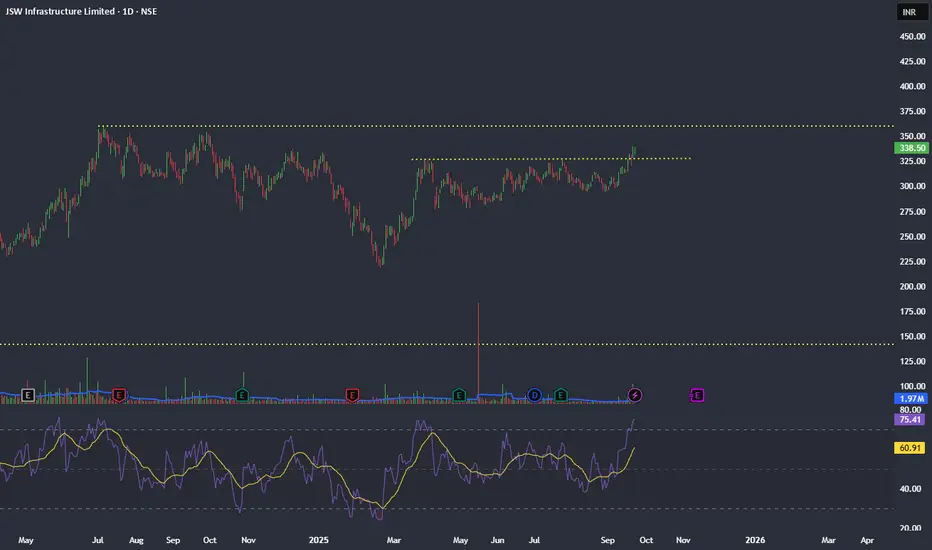
CMP: ~₹335–336 (Sept 22, 2025)
The stock is in a strong, long-term uptrend and is currently consolidating near a key resistance level.
It is trading well above its 50-day and 200-day Simple Moving Averages, which confirms the long-term bullish trend.
Multiple technical patterns, including an "inverted Head and Shoulders," have been identified, suggesting a potential breakout is imminent.
Indicators & Momentum
RSI (14): ~74.00 → The RSI is in the overbought zone, which could lead to short-term consolidation before further upside.
ADX (14): ~23.93 → The ADX indicates a "Weak Trend," suggesting a recent period of consolidation, which is consistent with the price action.
EMAs: The price is trading well above its 50-day SMA (~₹309) and 200-day SMA (~₹297), with both acting as strong support levels.
Volume & Market Structure
The recent price surge has been backed by exceptionally high volume (over 10.4 million shares), a massive increase from the average daily volume of the previous week.
This volume-backed price action confirms strong buyer interest and accumulation.
Key Levels
Resistance: The immediate resistance is the recent high around ₹339.90. A break above this can lead to a test of the all-time high of ₹360.95. The neckline of the Inverted H&S pattern is at ₹330, which is a critical level to watch.
Support: The immediate support is the previous resistance zone around ₹325–₹330. Below that, the accumulation zone and EMA cluster around ₹290–₹300 provides a solid cushion.
Upside Targets
T1: ₹357
T2: ₹381
T3: ₹420+ (Extended swing target based on analyst reports)
Invalidation
Close below ₹320 = short-term caution and pattern failure.
Close below the 50-day SMA (~₹309) = medium-term weakness.
Trading View Bias
Bias: Bullish above ₹330
Short-Term: ₹357 → ₹381
Medium-Term: Potential for a move towards ₹420 and beyond.
Cautionary Note
This analysis is for informational and educational purposes only and should not be considered as financial advice. The stock market is highly volatile, and prices can change rapidly. All investment decisions carry a degree of risk.
Haftungsausschluss
Die Informationen und Veröffentlichungen sind nicht als Finanz-, Anlage-, Handels- oder andere Arten von Ratschlägen oder Empfehlungen gedacht, die von TradingView bereitgestellt oder gebilligt werden, und stellen diese nicht dar. Lesen Sie mehr in den Nutzungsbedingungen.
Haftungsausschluss
Die Informationen und Veröffentlichungen sind nicht als Finanz-, Anlage-, Handels- oder andere Arten von Ratschlägen oder Empfehlungen gedacht, die von TradingView bereitgestellt oder gebilligt werden, und stellen diese nicht dar. Lesen Sie mehr in den Nutzungsbedingungen.