Confluence of a channel breakout, volume point and 200-day EMA
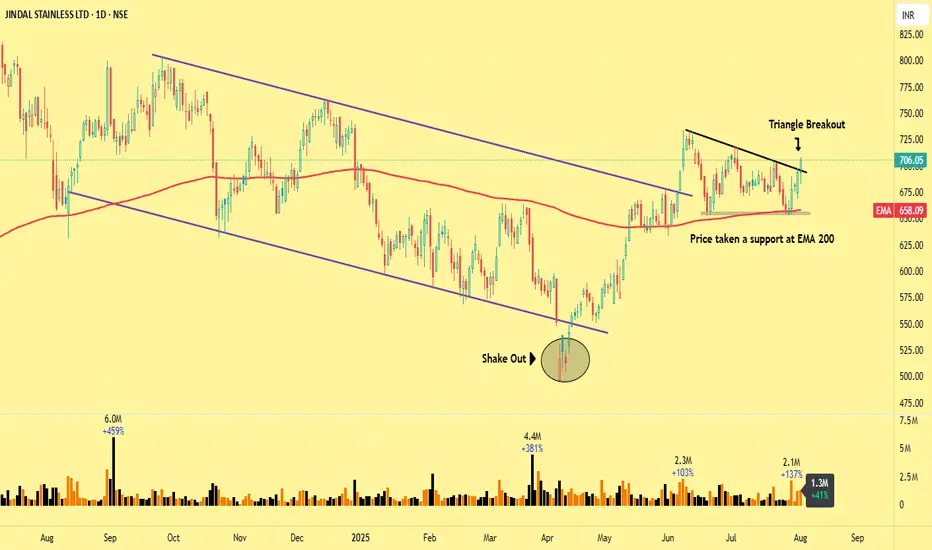
For a year, price trended lower within a well-defined descending parallel channel. In mid-April 2025, the stock shook out below the channel support but quickly recovered, signalling a false breakdown and accumulation. By late May, price decisively broke above the upper boundary of the channel and compressed into an ascending triangle. The 200-day EMA provided dynamic support and multiple pullbacks at or slightly above this EMA, confirming it as a reliable demand zone. The breakout leg coincided with above-average volume validating the move and suggesting follow up buying.
The long positions with proper risk controls, keeping a stop loss just below 200 EMA.
Disclaimer: The information and publications are not meant to be, and do not constitute, financial, investment, trading or any other types of advice or recommendations.
The long positions with proper risk controls, keeping a stop loss just below 200 EMA.
Disclaimer: The information and publications are not meant to be, and do not constitute, financial, investment, trading or any other types of advice or recommendations.
Haftungsausschluss
Die Informationen und Veröffentlichungen sind nicht als Finanz-, Anlage-, Handels- oder andere Arten von Ratschlägen oder Empfehlungen gedacht, die von TradingView bereitgestellt oder gebilligt werden, und stellen diese nicht dar. Lesen Sie mehr in den Nutzungsbedingungen.
Haftungsausschluss
Die Informationen und Veröffentlichungen sind nicht als Finanz-, Anlage-, Handels- oder andere Arten von Ratschlägen oder Empfehlungen gedacht, die von TradingView bereitgestellt oder gebilligt werden, und stellen diese nicht dar. Lesen Sie mehr in den Nutzungsbedingungen.