JNJ – Financial Performance & SWOT Analysis
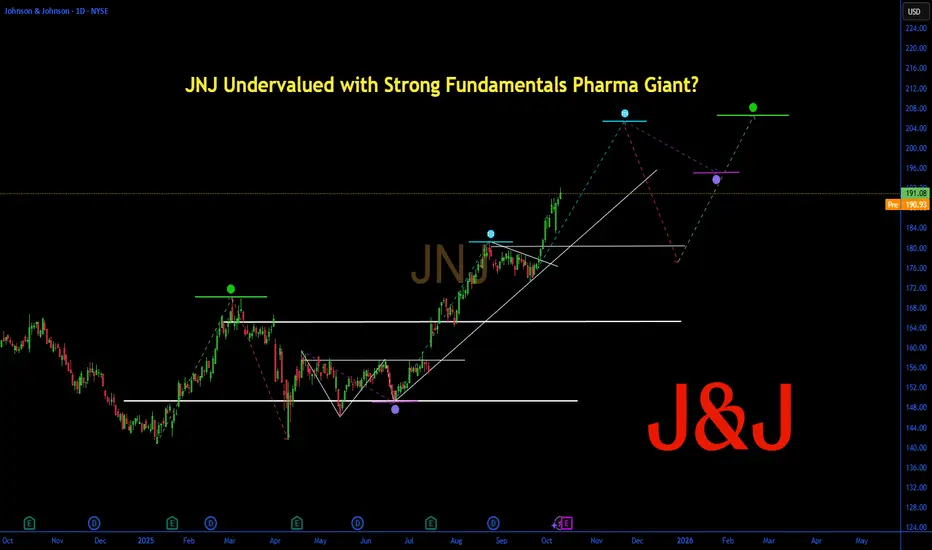
JNJ Undervalued with Strong Fundamentals Pharma Giant?
(1/9)
Good morning, folks! JNJ is steady 📈, at $ 191.08 up 35.31% YTD per October 10, 2025. Q2 revenue shakes up this pharma play , let’s dive in! 📊🔥 Tag a friend who needs this investing hack!
(2/9) – PRICE PERFORMANCE
• Last week: $ 191.08, up from $ 189.69 close 📈
• YTD 2025: up 35.31%, outpacing S&P 500 🔄
• Q2 2025: revenue up to $23.74B 🚀
This pharma stock’s volatility, earnings beats pop! 💥
(3/9) – MARKET POSITION
• Market Cap: $ 460.19B, industry leader 🏆
• Avg Volume: 8.67M shares, high liquidity 💧
• Trend: P/E 19.1x below fair ratio 👑
This asset’s dominance, holding tight! 🔒
(4/9) – KEY DEVELOPMENTS
• Q2 earnings: revenue $23.74B, EPS $2.77 beat 💰
• Price target: Goldman Sachs to $212 🏭
• Sentiment: undervalued on valuation models 📈
This pharma move, stable push! ⚡
(5/9) – RISKS IN FOCUS
• Regulations: pharma sector impacts ⚠️
• Competition: rising from peers 🆚
• Volatility: beta 0.39 swings 📉
This ticker’s exposure, watch these twists! ⚠️🔄
(6/9) – SWOT: STRENGTHS
• Earnings stability (consistent.): value driver 🌟
• Diversified portfolio (healthcare.): resilience 🤖
• Dividend yield (strong.): investor appeal 👥
This asset’s edge, built tough! 💪
(7/9) – SWOT: WEAKNESSES & OPPORTUNITIES
• Weaknesses: litigation risks, P/E adjustments ⚖️
• Opportunities: growth in medtech, undervaluation 🌍
Can this ticker beat the odds? 🎲 Reply with your take!
(8/9) – POLL TIME!
JNJ’s $ 191.08 value, your vibe?
• Bullish: $210+ soon, earnings beats 📈🚀
• Neutral: Steady, risks balanced ⚖️🛡️
• Bearish: $180 looms, regulation hits 📉⚠️
Chime in below! 💬 Tag a friend for this poll!
(9/9) – FINAL TAKEAWAY
JNJ’s $ 191.08 stance shows resilience 💪, fundamentals fuel it ⚡. Risks bite 🦈, yet dips are DCA gold 💎. We grab ‘em low, climb like pros! Gem or bust? not advice, just our spin!
#JNJ #Investing #Markets #Trading #Finance #ETF #Commodities #DCA #Trends
JNJ is potentially undervalued as of October 10, 2025, at $ 191.08, up 35.31% YTD per TradingView. Q2 revenue shapes its path in the pharma space. Here’s a factual financial and strategic breakdown.
**Financial Performance**
Price Movement: YTD at $ 191.08, up 35.31%. Broader period shows gains amid market rally. Q2 adds upside, with revenue $23.74B.
Volume & Market Cap: Avg volume 8.67M shares. Market cap at $ 460.19B.
Key Metric: Trailing P/E 20.46, forward P/E 16.42.
**SWOT Analysis**
Strengths:
- Diversified healthcare portfolio.
- Strong earnings and dividend yield.
- Market leadership in pharma.
Weaknesses:
- Litigation and regulatory risks.
- P/E adjustments for value.
- Exposure to economic cycles.
Opportunities:
- Growth in medtech and pharma.
- Undervaluation per models.
- Upcoming earnings potential.
Threats:
- Intense competition.
- Market corrections.
- Supply chain issues.
**JNJ vs. SPY: Key Comparisons**
| Aspect | JNJ | SPY |
|--------|------|-----|
| Purpose & Scope | Pharma and healthcare focus | Broad market index tracking |
| Dynamics | Beta 0.39 volatility vs. lower 1.00 | Steady benchmark |
| Market Position | Up 35.31% YTD, undervalued P/E vs. S&P gains | Stable exposure |
**Investor Considerations: DCA**
Dollar Cost Averaging: JNJ’s volatility suits dip-buying. At $ 191.08, $10,000 buys ~52 shares; a 10% dip to $ 172 nets ~58 shares.
**Outlook & Risks**
JNJ’s $ 191.08 position shows stable edge, with revenue growth. Regulations loom, yet dip grabs turn volatility into gains. Growth or dividends could sway it, but time’s our edge. Gem or fade? Depends on healthcare demand.
⚡️ Request a trial or subscribe to our premium🛠️tools at ➡️DCAlpha.net
All scripts & content provided by DCAChampion are for informational & educational purposes only.
All scripts & content provided by DCAChampion are for informational & educational purposes only.
Haftungsausschluss
Die Informationen und Veröffentlichungen sind nicht als Finanz-, Anlage-, Handels- oder andere Arten von Ratschlägen oder Empfehlungen gedacht, die von TradingView bereitgestellt oder gebilligt werden, und stellen diese nicht dar. Lesen Sie mehr in den Nutzungsbedingungen.