📊 Key Daily Levels (1-Day Timeframe)
1. Support Levels
~ ₹309.8 — identified by Research360 as a support.
~ ₹307.6 — second support per Research360.
~ ₹304.1 — a lower support per pivot-point analysis.
Broader support zone (per some analysts) lies around ₹305–325, but for day trading, the ~304–310 area is more relevant.
2. Resistance Levels
~ ₹315.5 — first resistance per pivot analysis.
~ ₹319.0 — second resistance point per the same.
~ ₹321.2 — third resistance.
3. Pivot / Reference
Daily central pivot is ~ ₹313.3 (from pivot-point analysis).
Motilal Oswal’s pivot point (daily) is ~ ₹308.
4. Trend and Indicators
According to Investing.com, the technical indicators on daily chart lean strong buy.
On Research360, the RSI is around ~56 (neutral-bullish).
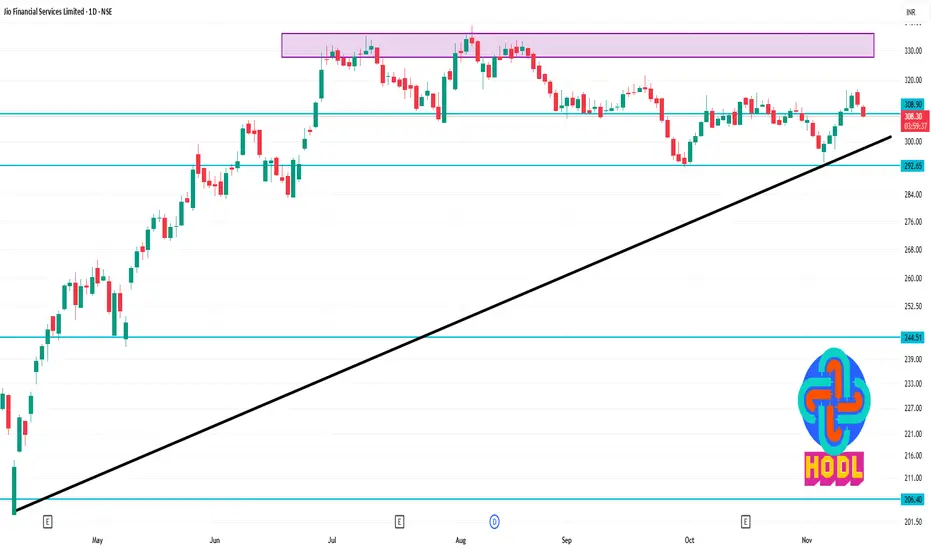
5. Larger View / Risk Zone
According to a TradingView analysis, there's a potential short-term dip toward ₹285–290 area if the current structure breaks down.
On the upside, that same analysis believes medium-term targets could go to ₹335+ if a breakout happens.
1. Support Levels
~ ₹309.8 — identified by Research360 as a support.
~ ₹307.6 — second support per Research360.
~ ₹304.1 — a lower support per pivot-point analysis.
Broader support zone (per some analysts) lies around ₹305–325, but for day trading, the ~304–310 area is more relevant.
2. Resistance Levels
~ ₹315.5 — first resistance per pivot analysis.
~ ₹319.0 — second resistance point per the same.
~ ₹321.2 — third resistance.
3. Pivot / Reference
Daily central pivot is ~ ₹313.3 (from pivot-point analysis).
Motilal Oswal’s pivot point (daily) is ~ ₹308.
4. Trend and Indicators
According to Investing.com, the technical indicators on daily chart lean strong buy.
On Research360, the RSI is around ~56 (neutral-bullish).
5. Larger View / Risk Zone
According to a TradingView analysis, there's a potential short-term dip toward ₹285–290 area if the current structure breaks down.
On the upside, that same analysis believes medium-term targets could go to ₹335+ if a breakout happens.
Verbundene Veröffentlichungen
Haftungsausschluss
Die Informationen und Veröffentlichungen sind nicht als Finanz-, Anlage-, Handels- oder andere Arten von Ratschlägen oder Empfehlungen gedacht, die von TradingView bereitgestellt oder gebilligt werden, und stellen diese nicht dar. Lesen Sie mehr in den Nutzungsbedingungen.