As of May 1, 2025, at 10:20 AM IST, ITC Ltd (NSE: ITC) is trading at ₹403.05. Based on recent technical analysis, here are the key support and resistance levels for the stock on a weekly (1W) chart:
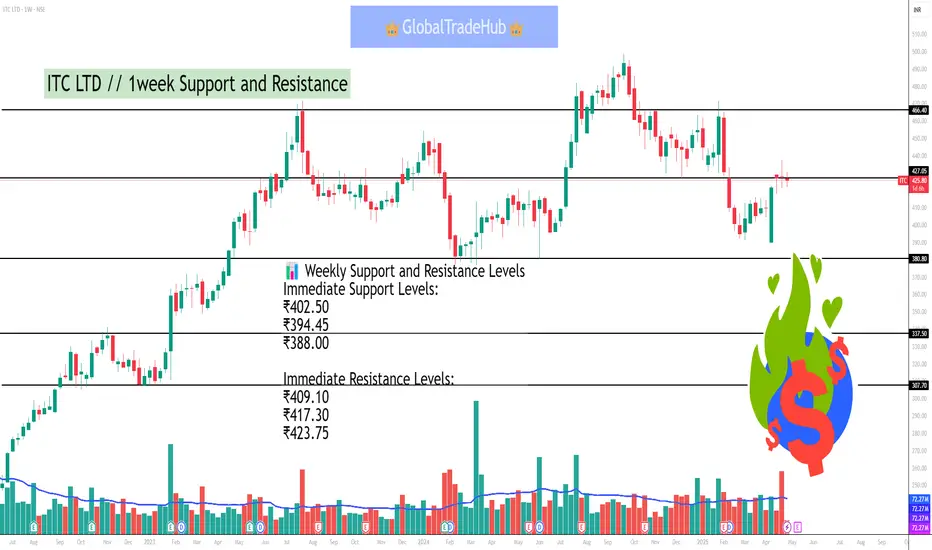
📊 Weekly Support and Resistance Levels
Immediate Support Levels:
₹402.50
₹394.45
₹388.00
Immediate Resistance Levels:
₹409.10
₹417.30
₹423.75
These levels suggest that if the stock price declines below ₹402.50, it may find support around ₹394.45 and ₹388.00. Conversely, if the price rises above ₹409.10, it could encounter resistance near ₹417.30 and ₹423.75.
🔍 Technical Indicators
ADX (Average Directional Index): 29.19 – indicates a trending market.
RSI (Relative Strength Index): 47.4 – suggests neutral momentum.
MACD (Moving Average Convergence Divergence): -4.66 – indicates a negative trend.
CCI (Commodity Channel Index): 2.74 – suggests neutral momentum.
These indicators suggest a neutral to slightly bearish outlook for ITC in the short term.
📈 Summary
ITC is currently trading near its immediate support levels. A break below ₹402.50 could lead to a decline towards ₹394.45 and ₹388.00. On the upside, resistance is observed at ₹409.10, ₹417.30, and ₹423.75. Traders should monitor these levels closely, as a decisive move beyond these support or resistance levels could signal the next directional move.
Verbundene Veröffentlichungen
Haftungsausschluss
Die Informationen und Veröffentlichungen sind nicht als Finanz-, Anlage-, Handels- oder andere Arten von Ratschlägen oder Empfehlungen gedacht, die von TradingView bereitgestellt oder gebilligt werden, und stellen diese nicht dar. Lesen Sie mehr in den Nutzungsbedingungen.