Indian Oil Corp (IOC) is showing a strong bullish structure, but it has arrived at a critical juncture where two significant resistance levels are converging. The price action suggests a battle between buyers and sellers is underway, and a decisive move is imminent.
The Bullish Foundation
After a year-long downtrend that ended in February 2025, the stock has carved out a clear new uptrend, consistently forming higher highs and higher lows. This upward momentum is well-supported by multiple technical indicators:
- Golden Crossover: A long-term bullish "Golden Crossover" of the Simple Moving Averages (SMAs) occurred a few months ago.
- Indicator Strength: The short-term Exponential Moving Averages (EMAs) and the Relative Strength Index (RSI) are in a bullish state across the Monthly, Weekly, and Daily timeframes.
The Resistance Test: A Mixed Signal
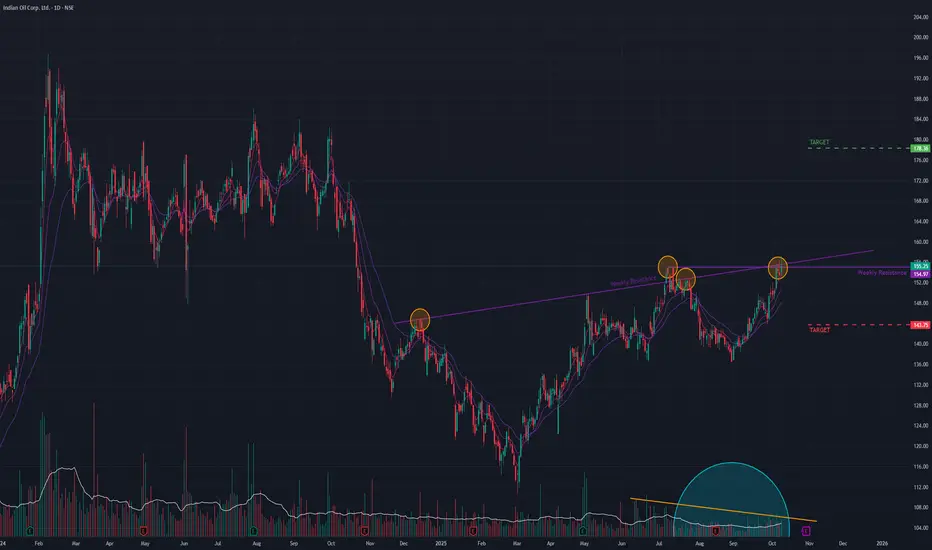
The primary challenge for IOC is a confluence of two resistance trendlines: a long-term angular resistance and a short-term horizontal resistance.
Today's trading session was a clear attempt to breach this zone, which resulted in a mixed signal:
- Partial Success: The stock managed to close above the short-term horizontal trendline, a minor positive.
- Key Rejection: However, while it did trade above the more critical long-term angular trendline intraday, it failed to hold these gains and closed below it.
This failure to close above the long-term resistance, combined with consolidating (non-expanding) volume, suggests that sellers are still active and buyers currently lack the conviction to force a decisive breakout.
Outlook and Key Levels
The next few trading sessions are crucial and will provide clarity.
- Bullish Scenario: A convincing daily close above the long-term angular trendline, especially if accompanied by an increase in volume, would confirm the breakout and signal a move towards the ₹178 level.
- Bearish Scenario: Continued rejection from this trendline could lead to a pullback, with the stock likely to find support around the ₹141 level.
The current price action warrants close monitoring. A breakout is clearly being attempted, but confirmation is required before a new directional trend can be established.
The Bullish Foundation
After a year-long downtrend that ended in February 2025, the stock has carved out a clear new uptrend, consistently forming higher highs and higher lows. This upward momentum is well-supported by multiple technical indicators:
- Golden Crossover: A long-term bullish "Golden Crossover" of the Simple Moving Averages (SMAs) occurred a few months ago.
- Indicator Strength: The short-term Exponential Moving Averages (EMAs) and the Relative Strength Index (RSI) are in a bullish state across the Monthly, Weekly, and Daily timeframes.
The Resistance Test: A Mixed Signal
The primary challenge for IOC is a confluence of two resistance trendlines: a long-term angular resistance and a short-term horizontal resistance.
Today's trading session was a clear attempt to breach this zone, which resulted in a mixed signal:
- Partial Success: The stock managed to close above the short-term horizontal trendline, a minor positive.
- Key Rejection: However, while it did trade above the more critical long-term angular trendline intraday, it failed to hold these gains and closed below it.
This failure to close above the long-term resistance, combined with consolidating (non-expanding) volume, suggests that sellers are still active and buyers currently lack the conviction to force a decisive breakout.
Outlook and Key Levels
The next few trading sessions are crucial and will provide clarity.
- Bullish Scenario: A convincing daily close above the long-term angular trendline, especially if accompanied by an increase in volume, would confirm the breakout and signal a move towards the ₹178 level.
- Bearish Scenario: Continued rejection from this trendline could lead to a pullback, with the stock likely to find support around the ₹141 level.
The current price action warrants close monitoring. A breakout is clearly being attempted, but confirmation is required before a new directional trend can be established.
Disclaimer: This analysis is my personal view & for educational purposes only. They shall not be construed as trade or investment advice. Before making any financial decision, it is imperative that you consult with a qualified financial professional.
Haftungsausschluss
Die Informationen und Veröffentlichungen sind nicht als Finanz-, Anlage-, Handels- oder andere Arten von Ratschlägen oder Empfehlungen gedacht, die von TradingView bereitgestellt oder gebilligt werden, und stellen diese nicht dar. Lesen Sie mehr in den Nutzungsbedingungen.