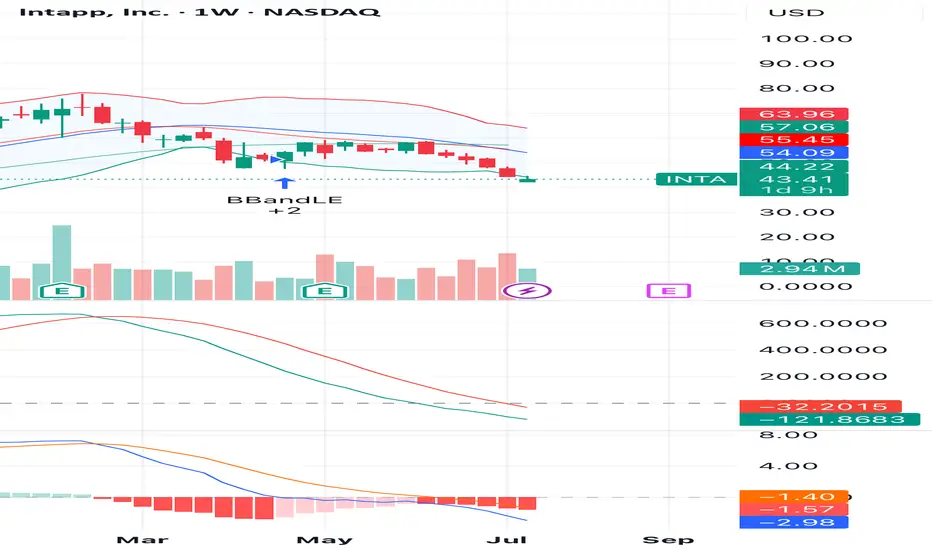
INTA is showing signs of a potential reversal after a consistent downtrend. On the weekly chart, the price touched the lower Bollinger Band with increased buying volume and a bullish candle forming. This may signal the end of the selling pressure.
Momentum indicators such as MACD and KST are flattening, suggesting a possible shift in momentum. A break above $44.22 could confirm a short-term bounce.
📈 Entry Zone: $43.00 – $44.50
🎯 Target 1: $54.00
🎯 Target 2: $57.00
🛑 Stop Loss: Below $41.00
This idea is based on technical signals; monitor volume and market conditions closely.
Haftungsausschluss
Die Informationen und Veröffentlichungen sind nicht als Finanz-, Anlage-, Handels- oder andere Arten von Ratschlägen oder Empfehlungen gedacht, die von TradingView bereitgestellt oder gebilligt werden, und stellen diese nicht dar. Lesen Sie mehr in den Nutzungsbedingungen.
Haftungsausschluss
Die Informationen und Veröffentlichungen sind nicht als Finanz-, Anlage-, Handels- oder andere Arten von Ratschlägen oder Empfehlungen gedacht, die von TradingView bereitgestellt oder gebilligt werden, und stellen diese nicht dar. Lesen Sie mehr in den Nutzungsbedingungen.