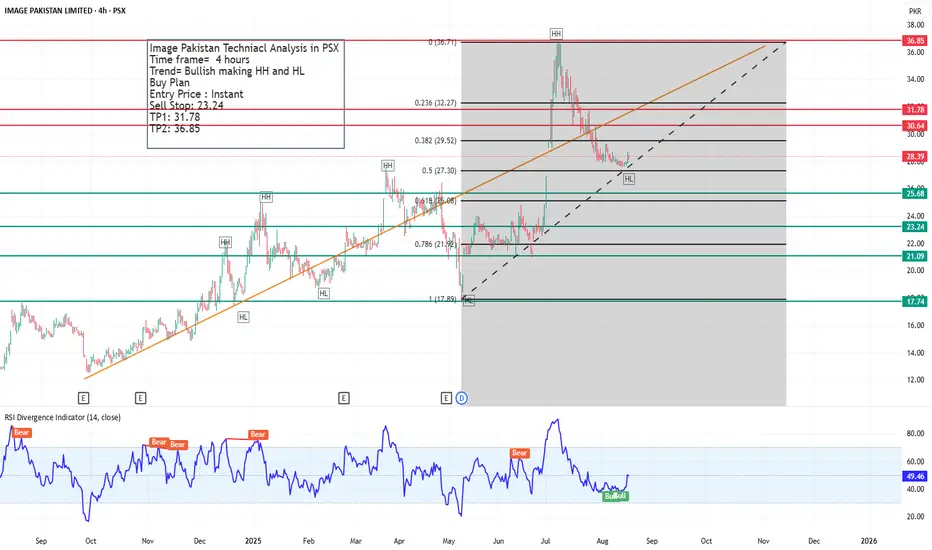
Overall Trend
The stock is in a bullish structure, forming Higher Highs (HH) and Higher Lows (HL) on the 4-hour timeframe.
Currently, the price is holding above recent support and showing a possible continuation of the bullish trend.
📈 Chart Highlights
Trendline Support & Fibonacci Retracement
Price retraced from the 36.71 PKR peak and found support near the 0.618 retracement (25.86 PKR).
It respected the trendline support and bounced, confirming higher low (HL) formation around 28 PKR.
Entry & Risk Management
Entry: Instant (current level ~28.39 PKR).
Stop Loss (Sell Stop): 23.24 PKR (below trendline & key Fib level).
Target Levels (Take Profit)
TP1: 31.78 PKR (near 0.236 Fib resistance).
TP2: 36.85 PKR (previous swing high / top).
📊 Indicators
RSI Divergence Indicator (14-period):
Currently at 49.46, near the neutral zone.
Recent Bullish Divergence has been printed, suggesting possible momentum shift upward.
🔑 Trading View
The stock is in a bullish continuation phase unless it breaks below 23.24 PKR.
Above 29.50 PKR (Fib 0.382), strength will increase toward TP1 and TP2.
If the price consolidates near current levels, it can attract more buyers for the next rally.
✅ Summary: Image Pakistan Limited on PSX is technically bullish, forming HH & HL. A buy setup is active with TP1 = 31.78 and TP2 = 36.85, while keeping 23.24 as the protective stop loss. RSI also supports the bullish view.
Haftungsausschluss
Die Informationen und Veröffentlichungen sind nicht als Finanz-, Anlage-, Handels- oder andere Arten von Ratschlägen oder Empfehlungen gedacht, die von TradingView bereitgestellt oder gebilligt werden, und stellen diese nicht dar. Lesen Sie mehr in den Nutzungsbedingungen.
Haftungsausschluss
Die Informationen und Veröffentlichungen sind nicht als Finanz-, Anlage-, Handels- oder andere Arten von Ratschlägen oder Empfehlungen gedacht, die von TradingView bereitgestellt oder gebilligt werden, und stellen diese nicht dar. Lesen Sie mehr in den Nutzungsbedingungen.