ICICIPRULI – Hidden Pattern Unlocked! Reversal or Continuation?
ICICIPRULI Pattern Reveal
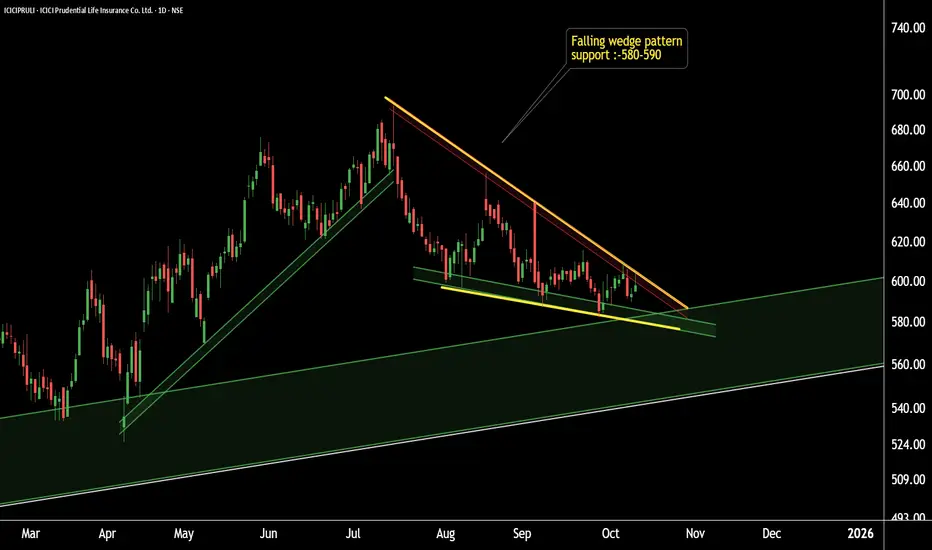
This is the daily timeframe chart of ICICIPRULI.
The stock is forming a falling wedge pattern, which is a bullish reversal setup.
Currently, ICICIPRULI is holding strong support near the 580–590 zone based on pattern structure.
If this level sustains, we may see higher prices in the coming sessions.
Thank You !!
@RahulSaraoge
Connect us at t.me/stridesadvisory
Connect us at t.me/stridesadvisory
Haftungsausschluss
Die Informationen und Veröffentlichungen sind nicht als Finanz-, Anlage-, Handels- oder andere Arten von Ratschlägen oder Empfehlungen gedacht, die von TradingView bereitgestellt oder gebilligt werden, und stellen diese nicht dar. Lesen Sie mehr in den Nutzungsbedingungen.