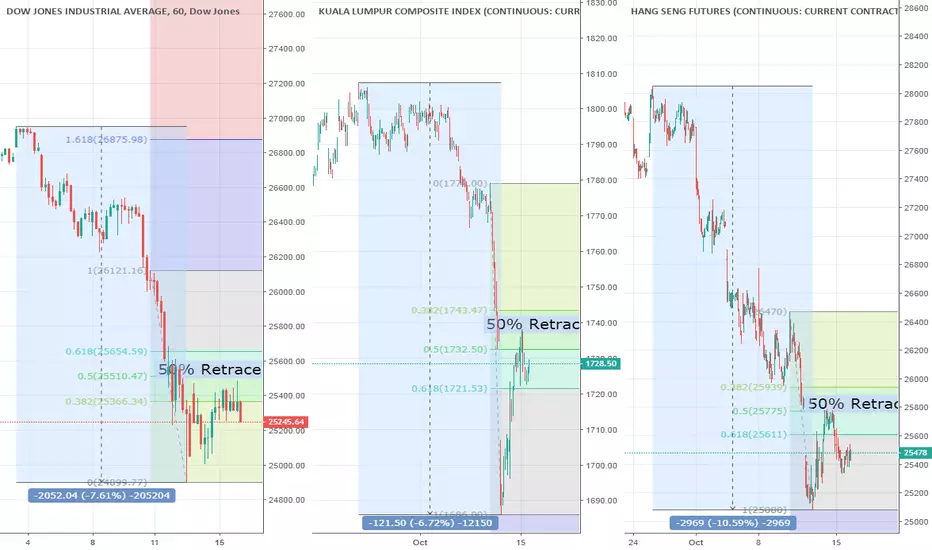
The sharp declined in indexes market have not make significant come back yet since 11 Oct.
The 3 charts plotted in 60 minitues time frame. From the left
- Dow declined 7.6% from the peak, and rebound to 50% ratracement ( 25510) and trade below.
- FKLI declined 6.7% from the peak, and rebound to slightly higher than 50% ratracement (1738) and retraced.
- Hang Seng declined 10.5% from the recent peak, among the worst performing market, and rebound to 50% ratracement (25775) and trade below.
The current price structure in correction stage with no indication of bullish yet.
Haftungsausschluss
Die Informationen und Veröffentlichungen sind nicht als Finanz-, Anlage-, Handels- oder andere Arten von Ratschlägen oder Empfehlungen gedacht, die von TradingView bereitgestellt oder gebilligt werden, und stellen diese nicht dar. Lesen Sie mehr in den Nutzungsbedingungen.
Haftungsausschluss
Die Informationen und Veröffentlichungen sind nicht als Finanz-, Anlage-, Handels- oder andere Arten von Ratschlägen oder Empfehlungen gedacht, die von TradingView bereitgestellt oder gebilligt werden, und stellen diese nicht dar. Lesen Sie mehr in den Nutzungsbedingungen.