📈 1-Month Performance Overview
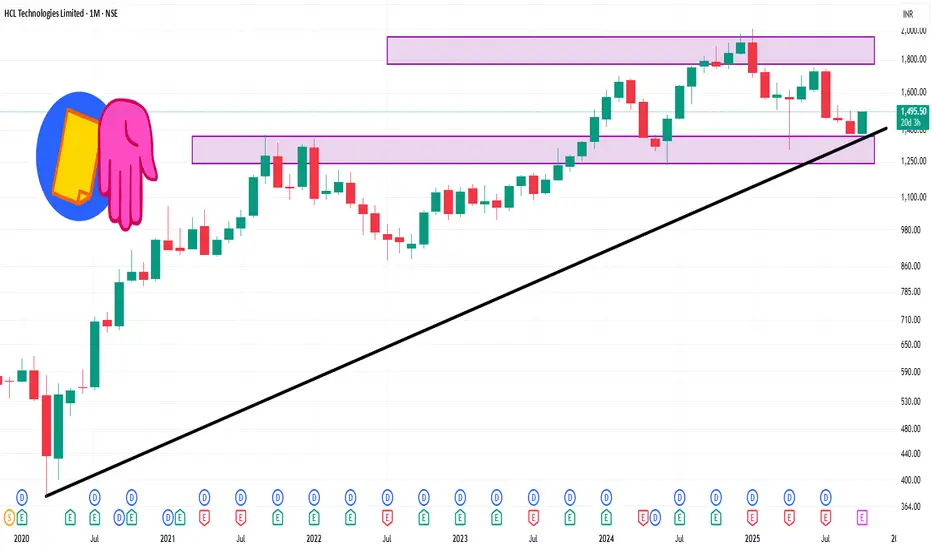
Current Price: ₹1,495.50
1-Month Change: +4.19%
52-Week Range: ₹1,302.75 – ₹2,012.20
Market Capitalization: ₹4,05,612 crore
P/E Ratio (TTM): 23.88
Dividend Yield: 4.02%
Over the past month, HCL Technologies has shown a steady upward trend, outperforming the Nifty IT Index, which has gained approximately 0.33% during the same period.
📊 Technical Snapshot
1-Month High: ₹1,502.90
1-Month Low: ₹1,380.40
Average Price: ₹1,443.09
Price Change: +2.16%
Verbundene Veröffentlichungen
Haftungsausschluss
Die Informationen und Veröffentlichungen sind nicht als Finanz-, Anlage-, Handels- oder andere Arten von Ratschlägen oder Empfehlungen gedacht, die von TradingView bereitgestellt oder gebilligt werden, und stellen diese nicht dar. Lesen Sie mehr in den Nutzungsbedingungen.