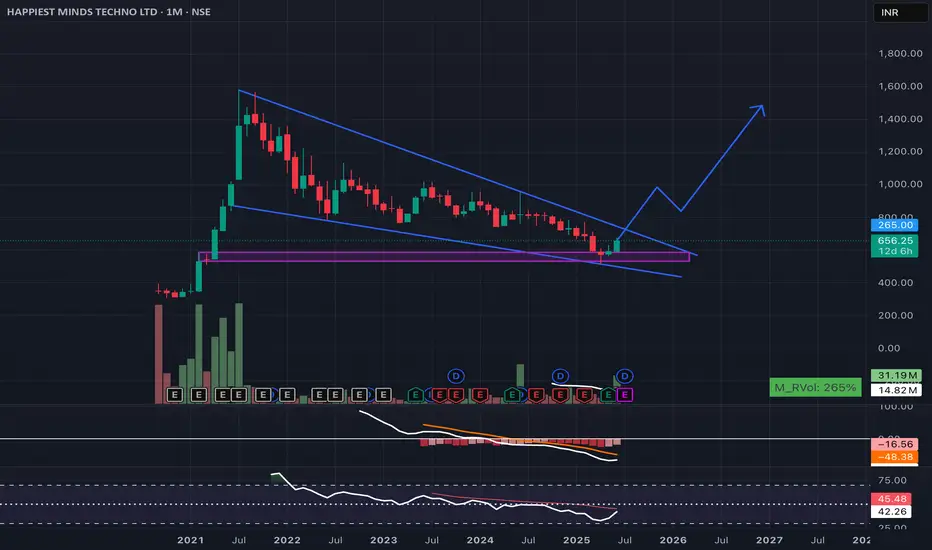
📈 HAPPIEST MINDS – Falling Wedge Breakout on Monthly Chart
Date: June 18, 2025 | Exchange: NSE | Timeframe: Monthly
Happiest Minds is showing signs of a potential long-term trend reversal. Price is breaking out of a falling wedge pattern after a multi-month downtrend, with strong bullish momentum this month (+10.47%).
Key Points:
* Pattern: Falling wedge breakout
* Volume: Spike with 265% RVOL – early accumulation
* MACD: Bearish momentum fading
* RSI: Bouncing from oversold zone
View: Long-term bullish reversal in play. Sustained close above trendline could trigger a fresh uptrend toward 1200–1500 levels in the coming quarters.
Haftungsausschluss
Die Informationen und Veröffentlichungen sind nicht als Finanz-, Anlage-, Handels- oder andere Arten von Ratschlägen oder Empfehlungen gedacht, die von TradingView bereitgestellt oder gebilligt werden, und stellen diese nicht dar. Lesen Sie mehr in den Nutzungsbedingungen.
Haftungsausschluss
Die Informationen und Veröffentlichungen sind nicht als Finanz-, Anlage-, Handels- oder andere Arten von Ratschlägen oder Empfehlungen gedacht, die von TradingView bereitgestellt oder gebilligt werden, und stellen diese nicht dar. Lesen Sie mehr in den Nutzungsbedingungen.