Gold Forms Bullish Trend Structure on 15-Minute Chart – Key Levels to Watch
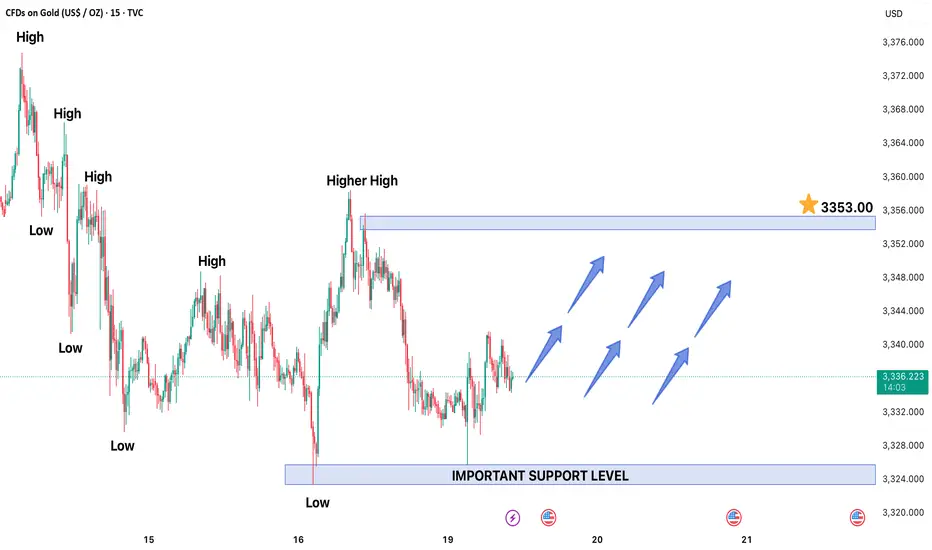
Gold has established a bullish trend structure on the 15-minute chart, signaling potential upward momentum in the near term. The recent price action confirmed this bias as the market printed a higher high, a classic indicator of an uptrend. This suggests that buyers are in control, and the bullish sentiment may persist in the upcoming trading sessions.
Key Resistance and Upside Target
If the bullish momentum continues, the next key target for gold is 3353.00. A breakout above recent highs could accelerate buying pressure, pushing prices toward this level. Traders should watch for sustained buying interest and higher lows to confirm further upside potential.
Critical Support Level
On the downside, 3323.00 is expected to act as a strong support zone. If prices retrace, this level could serve as a buying opportunity, provided the bullish structure remains intact. A break below this support, however, may indicate a weakening trend, potentially leading to a deeper pullback.
Trading Strategy
- Bullish Scenario: Traders may consider long positions if gold holds above 3323.00, targeting 3353.00 with a stop-loss below the support.
- Bearish Caution: A drop below **3323.00** could signal a trend reversal or consolidation, prompting traders to reassess their positions.
Given the current technical setup, gold remains biased to the upside, but traders should monitor price action around these key levels for confirmation. Proper risk management is essential to navigate potential volatility.
Haftungsausschluss
Die Informationen und Veröffentlichungen sind nicht als Finanz-, Anlage-, Handels- oder andere Arten von Ratschlägen oder Empfehlungen gedacht, die von TradingView bereitgestellt oder gebilligt werden, und stellen diese nicht dar. Lesen Sie mehr in den Nutzungsbedingungen.
Haftungsausschluss
Die Informationen und Veröffentlichungen sind nicht als Finanz-, Anlage-, Handels- oder andere Arten von Ratschlägen oder Empfehlungen gedacht, die von TradingView bereitgestellt oder gebilligt werden, und stellen diese nicht dar. Lesen Sie mehr in den Nutzungsbedingungen.
