Date: July 23, 2025
Instrument: Gold (XAU/USD)
Chart Type: Daily (1D)
Source: TradingView
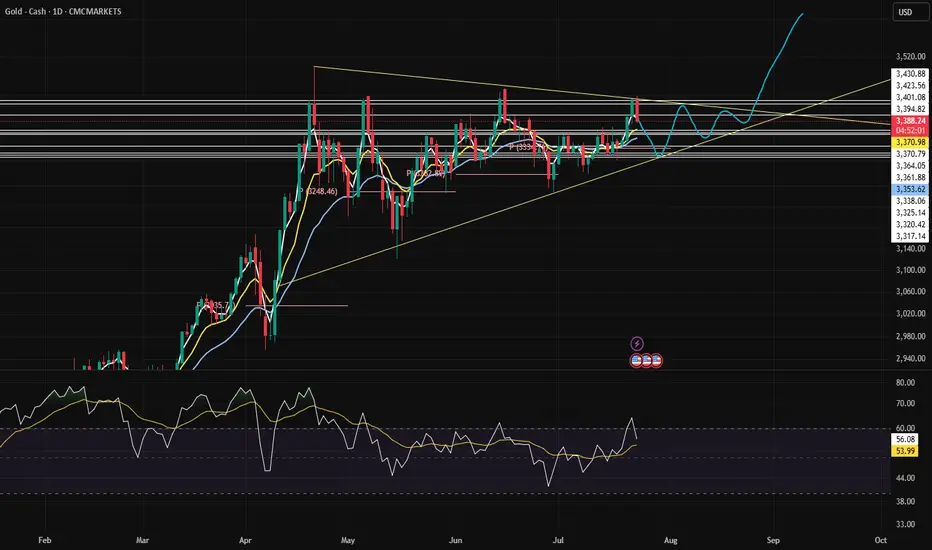
The price of gold is currently consolidating within a symmetrical triangle pattern, suggesting a potential breakout in the coming weeks. As of July 23, gold is trading around $3,390, down by 1.21% on the day. The chart highlights key support and resistance levels, trendlines, and a possible breakout path, providing valuable insight into future price action.
Technical Overview
Pattern Forming: A symmetrical triangle formed since early April, with higher lows and lower highs converging toward an apex.
Support Levels: $3,371.36, $3,370.79, and the lower ascending trendline.
Resistance Levels: $3,395.78, $3,401.08, and the horizontal zone near $3,430.88.
Indicators:
Moving Averages (likely EMA or SMA): Price is interacting with short- and mid-term MAs.
RSI (Relative Strength Index): Currently around 56, indicating bullish momentum without being overbought.
Forecast and Price Path
The chart includes a forecasted price path (in blue) that outlines a possible movement:
A short-term dip to retest the triangle’s lower support area near $3,370.
A bounce followed by sideways consolidation within the triangle.
A bullish breakout projected around early August.
A sharp upward trajectory targeting levels above $3,500, suggesting a strong bullish continuation if the breakout occurs as expected.
Conclusion
This symmetrical triangle is a classic continuation pattern, and given the overall bullish trend from earlier this year, the market may lean toward a breakout to the upside. However, confirmation is crucial: a strong daily close above $3,430 would validate the bullish breakout, while a drop below $3,370 could invalidate this scenario and hint at further consolidation or a downside move.
Traders should watch for volume spikes and RSI behavior near the triangle's apex for clearer breakout signals. Until then, gold remains in a tightening range—preparing for its next major move.
Instrument: Gold (XAU/USD)
Chart Type: Daily (1D)
Source: TradingView
The price of gold is currently consolidating within a symmetrical triangle pattern, suggesting a potential breakout in the coming weeks. As of July 23, gold is trading around $3,390, down by 1.21% on the day. The chart highlights key support and resistance levels, trendlines, and a possible breakout path, providing valuable insight into future price action.
Technical Overview
Pattern Forming: A symmetrical triangle formed since early April, with higher lows and lower highs converging toward an apex.
Support Levels: $3,371.36, $3,370.79, and the lower ascending trendline.
Resistance Levels: $3,395.78, $3,401.08, and the horizontal zone near $3,430.88.
Indicators:
Moving Averages (likely EMA or SMA): Price is interacting with short- and mid-term MAs.
RSI (Relative Strength Index): Currently around 56, indicating bullish momentum without being overbought.
Forecast and Price Path
The chart includes a forecasted price path (in blue) that outlines a possible movement:
A short-term dip to retest the triangle’s lower support area near $3,370.
A bounce followed by sideways consolidation within the triangle.
A bullish breakout projected around early August.
A sharp upward trajectory targeting levels above $3,500, suggesting a strong bullish continuation if the breakout occurs as expected.
Conclusion
This symmetrical triangle is a classic continuation pattern, and given the overall bullish trend from earlier this year, the market may lean toward a breakout to the upside. However, confirmation is crucial: a strong daily close above $3,430 would validate the bullish breakout, while a drop below $3,370 could invalidate this scenario and hint at further consolidation or a downside move.
Traders should watch for volume spikes and RSI behavior near the triangle's apex for clearer breakout signals. Until then, gold remains in a tightening range—preparing for its next major move.
Haftungsausschluss
Die Informationen und Veröffentlichungen sind nicht als Finanz-, Anlage-, Handels- oder andere Arten von Ratschlägen oder Empfehlungen gedacht, die von TradingView bereitgestellt oder gebilligt werden, und stellen diese nicht dar. Lesen Sie mehr in den Nutzungsbedingungen.
Haftungsausschluss
Die Informationen und Veröffentlichungen sind nicht als Finanz-, Anlage-, Handels- oder andere Arten von Ratschlägen oder Empfehlungen gedacht, die von TradingView bereitgestellt oder gebilligt werden, und stellen diese nicht dar. Lesen Sie mehr in den Nutzungsbedingungen.