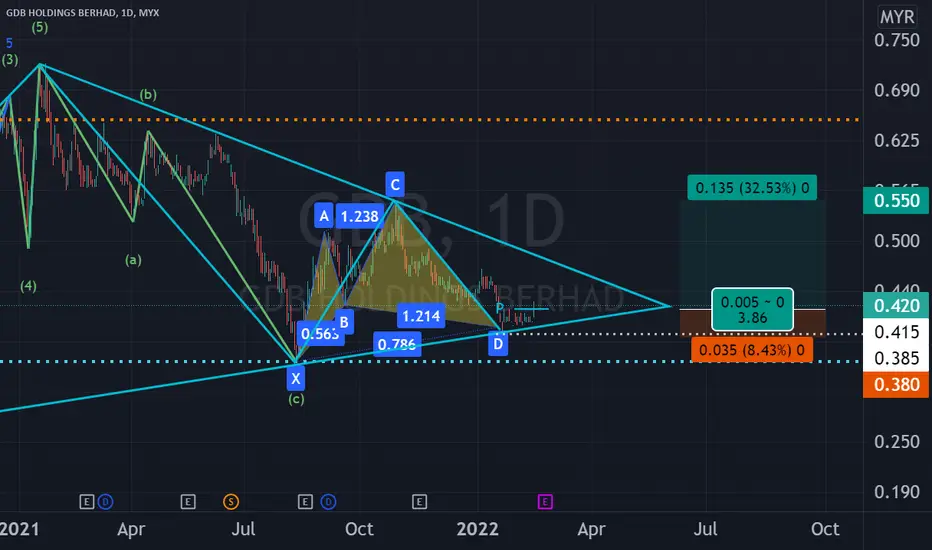
Consider to study, analyze and monitor GDB in its daily chart where the following patterns appear to have been formed: 1. Triangle; 2. Bullish Cypher and 3. EW ABC Corrective Zone at C zone.
Trade within the triangle or trade as per the potential Cypher Pattern Trading Plan as depicted in the chart.
This is not a trade or investment call but for study and sharing purposes only with a view to develop and enhance one's trading knowledge and skill. Trade at your own risk.
Trade within the triangle or trade as per the potential Cypher Pattern Trading Plan as depicted in the chart.
This is not a trade or investment call but for study and sharing purposes only with a view to develop and enhance one's trading knowledge and skill. Trade at your own risk.
Haftungsausschluss
Die Informationen und Veröffentlichungen sind nicht als Finanz-, Anlage-, Handels- oder andere Arten von Ratschlägen oder Empfehlungen gedacht, die von TradingView bereitgestellt oder gebilligt werden, und stellen diese nicht dar. Lesen Sie mehr in den Nutzungsbedingungen.
Haftungsausschluss
Die Informationen und Veröffentlichungen sind nicht als Finanz-, Anlage-, Handels- oder andere Arten von Ratschlägen oder Empfehlungen gedacht, die von TradingView bereitgestellt oder gebilligt werden, und stellen diese nicht dar. Lesen Sie mehr in den Nutzungsbedingungen.