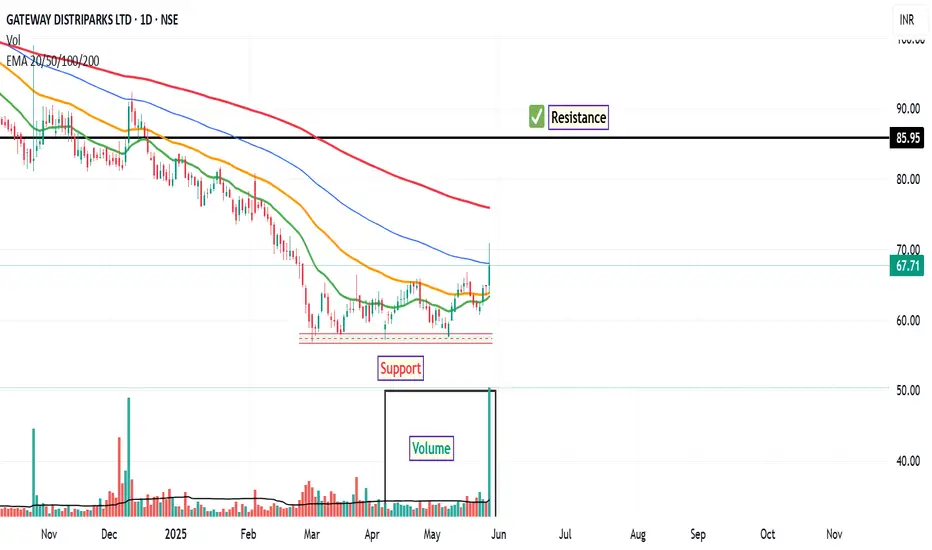
In the latest trading session, Gateway Distriparks Ltd demonstrated notable technical strength. The stock successfully closed above both its 20D and 50D EMAs, indicating a potential shift in short- to medium-term momentum. Additionally, it managed to close above the 20-week EMA, which may suggest a broader trend alignment in favour of the bulls.
Volume analysis further supports this view, with a noticeable uptick in trading activity accompanying the price movement—often interpreted as a sign of institutional interest or increased market participation.
The RSI has crossed above the 65 level, a zone that is frequently associated with strong bullish momentum. This development may be interpreted by some market participants as a signal of continued buying interest.
From a price action perspective, the stock appears technically favorable in the range of ₹64, with a potential resistance zone near ₹85. A prudent risk management approach might involve monitoring for a close below ₹56, which could serve as a reference point for reevaluating the trade setup.
Disclaimer:
This analysis is intended solely for informational and educational purposes. It does not constitute investment advice or a recommendation to buy or sell any financial instrument. Market participants are strongly encouraged to conduct their own due diligence or consult with a certified financial advisor before making any investment decisions.
Haftungsausschluss
Die Informationen und Veröffentlichungen sind nicht als Finanz-, Anlage-, Handels- oder andere Arten von Ratschlägen oder Empfehlungen gedacht, die von TradingView bereitgestellt oder gebilligt werden, und stellen diese nicht dar. Lesen Sie mehr in den Nutzungsbedingungen.
Haftungsausschluss
Die Informationen und Veröffentlichungen sind nicht als Finanz-, Anlage-, Handels- oder andere Arten von Ratschlägen oder Empfehlungen gedacht, die von TradingView bereitgestellt oder gebilligt werden, und stellen diese nicht dar. Lesen Sie mehr in den Nutzungsbedingungen.