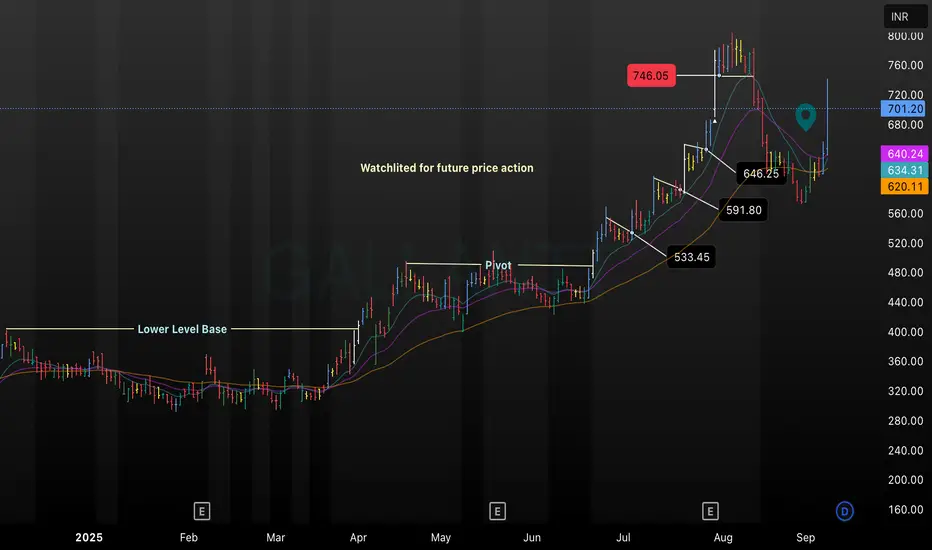
This chart analyzes Gallantt’s breakout momentum, highlighting the transition from a lower base to a sustained uptrend and pinpointing pivotal support levels at ₹533.45, ₹591.80, and ₹646.25. Moving averages show bullish alignment, with price action currently watchlisted for further movement above ₹701.20. The setup provides traders with actionable levels for both entry and risk management, ideal for monitoring continued strength or retracement opportunities.
Haftungsausschluss
Die Informationen und Veröffentlichungen sind nicht als Finanz-, Anlage-, Handels- oder andere Arten von Ratschlägen oder Empfehlungen gedacht, die von TradingView bereitgestellt oder gebilligt werden, und stellen diese nicht dar. Lesen Sie mehr in den Nutzungsbedingungen.
Haftungsausschluss
Die Informationen und Veröffentlichungen sind nicht als Finanz-, Anlage-, Handels- oder andere Arten von Ratschlägen oder Empfehlungen gedacht, die von TradingView bereitgestellt oder gebilligt werden, und stellen diese nicht dar. Lesen Sie mehr in den Nutzungsbedingungen.
