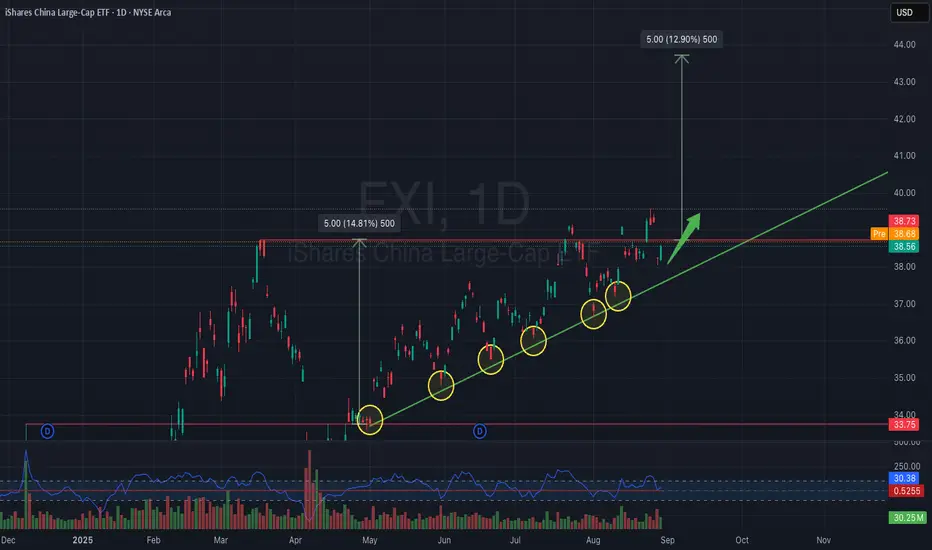
The chart of iShares China Large-Cap ETF (FXI) shows a strong ascending trendline, tested multiple times (yellow circles), confirming bullish support.
Currently, FXI is consolidating just below resistance at $39, and a breakout above this level could trigger a strong upward move. The projected target is around $43–44, which aligns with a 12–13% upside potential.
Entry Zone: Above $39 breakout
Target Price: $43–44
Stop Loss: Below $37 (trendline support)
Momentum is supported by higher lows, consistent trendline touches, and a constructive RSI setup. If the breakout holds, bulls may push FXI toward prior highs.
Haftungsausschluss
Die Informationen und Veröffentlichungen sind nicht als Finanz-, Anlage-, Handels- oder andere Arten von Ratschlägen oder Empfehlungen gedacht, die von TradingView bereitgestellt oder gebilligt werden, und stellen diese nicht dar. Lesen Sie mehr in den Nutzungsbedingungen.
Haftungsausschluss
Die Informationen und Veröffentlichungen sind nicht als Finanz-, Anlage-, Handels- oder andere Arten von Ratschlägen oder Empfehlungen gedacht, die von TradingView bereitgestellt oder gebilligt werden, und stellen diese nicht dar. Lesen Sie mehr in den Nutzungsbedingungen.