Navigating the $FTX Token Recovery: A 4-Hour Chart Insight
Price Action Description
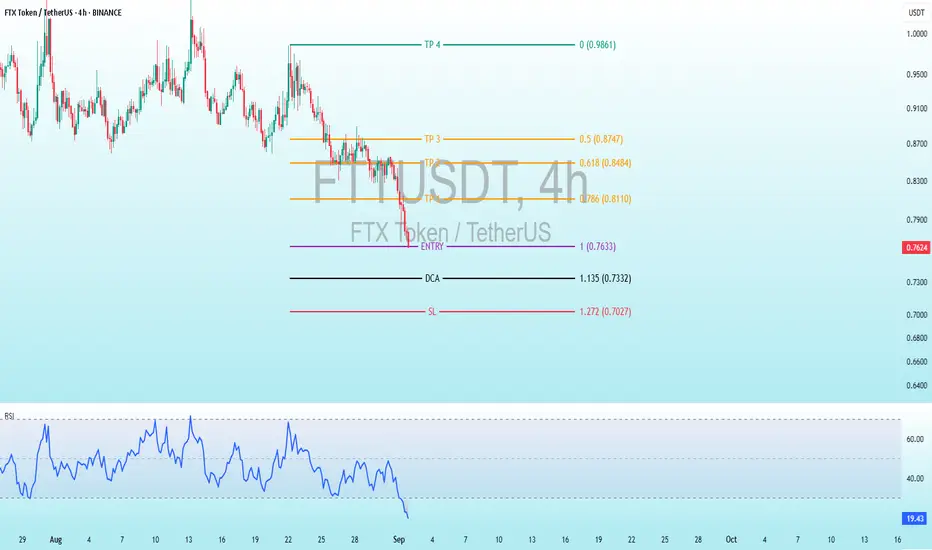
Historical Trend: The price began around 0.09-0.10 USDT in late August, with a choppy uptrend reaching near 0.11 USDT in early September. A sharp decline followed, dropping to the current level of 0.7653 USDT, indicating a significant correction.
Recent Movement: A prominent red candlestick around September 1 marks a drop from approximately 0.10-0.11 USDT to 0.7653 USDT, suggesting strong selling pressure or a market reaction. The price has stabilized near this low, with smaller candles hinting at consolidation.
Current Price: Approximately 0.7653 USDT, down about 20-30% from recent highs, suggesting potential oversold conditions.
Volatility: High, as evident from the long wicks and large candle bodies during the recent drop, though volume data is not visible.
Key Technical Levels
Entry: Set at 0.7633 USDT, the suggested point to enter a long position, very close to the current price of 0.7653 USDT, indicating an immediate buy opportunity with minimal pullback expected.
TP (Take Profit): Targets are 0.0874 USDT for the first profit take, followed by 0.8484 USDT, 0.8110 USDT, and the highest goal at 0.9810 USDT, providing a range of exit points for potential gains.
DCA: Positioned at 0.7332 USDT, a level to add to the trade if the price dips slightly, helping to average down the entry cost.
SL (Stop Loss): Placed at 0.7072 USDT, the cutoff to exit the trade if the price falls, limiting losses and protecting the position.
Fibonacci Context: These levels likely derive from a Fibonacci retracement or extension tool applied to the recent drop from 0.11 USDT to 0.7653 USDT, suggesting a potential reversal zone for a long setup.
Risk-Reward: Risk from 0.7633 to 0.7072 is 0.0561 USDT, with rewards to 0.8110 (0.0477, RR 0.85:1) and up to 0.9810 (0.2177, RR ~3.88:1), indicating a decent setup if the bounce occurs.
Indicators Analysis
RSI (Relative Strength Index): Current value is 19.94, below 30, signaling oversold conditions and a potential rebound. The line has trended downward sharply with the recent drop, showing momentum weakening, but no clear bullish divergence yet. The RSI scale (0-100) marks overbought above 70, not relevant here.
Potential Trading Implications and Risks
Bullish Case: The setup suggests a bottom-fishing opportunity post-drop, supported by oversold RSI. A rebound to take-profit levels is plausible if the broader crypto market stabilizes or if sentiment around FTX Token improves (e.g., legal or exchange-related developments).
Bearish Case: The recent sharp decline and lack of immediate recovery indicate ongoing selling pressure. Breaking below 0.7072 (SL) could lead to further declines toward 0.70 USDT or lower.
Risks: High volatility due to FTT’s history, lack of volume data (limiting liquidity insight), and subjective Fib levels. Use risk management (e.g., 1-2% account risk).
Suggestions: Confirm with bullish patterns (e.g., hammer) at 0.7633 or RSI crossing above 30.
Trade ist aktiv
ENTRY 0.7633 TARGET SCALP ✅ +6.31% PROFIT
🔄 A loss today is a setup for a win tomorrow.
Interested for Premium 👉 t.me/Altcoin_Piooners
Follow for signals! 🔥#Crypto #Trading #CryptoSignals #FTT #Altcoins
Trade geschlossen: Ziel wurde erreicht
ENTRY 0.7633 ALL TP ✅ +59.56% PROFIT
📖 Profit or loss, every trade builds your story.
Interested for Premium 👉 t.me/Altcoin_Piooners
Follow for signals! 🔥#Crypto #Trading #CryptoSignals #FTT #Altcoins
✅MY Free Signals Telegram
t.me/AltcoinPiooners
✅Personal Telegram (Premium)
t.me/Altcoin_Piooners
✅YouTube
youtube.com/@AltcoinPiooners
t.me/AltcoinPiooners
✅Personal Telegram (Premium)
t.me/Altcoin_Piooners
✅YouTube
youtube.com/@AltcoinPiooners
Haftungsausschluss
Die Informationen und Veröffentlichungen sind nicht als Finanz-, Anlage-, Handels- oder andere Arten von Ratschlägen oder Empfehlungen gedacht, die von TradingView bereitgestellt oder gebilligt werden, und stellen diese nicht dar. Lesen Sie mehr in den Nutzungsbedingungen.