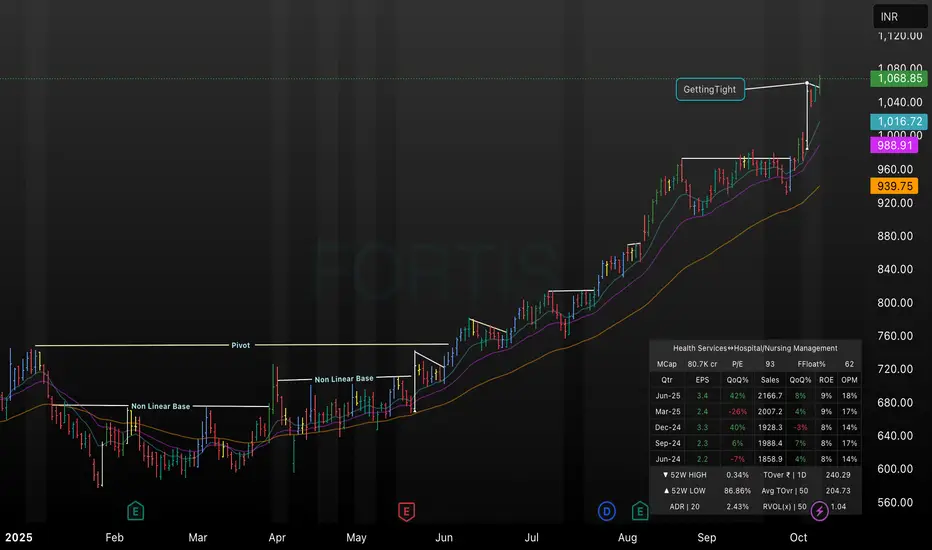
This TradingView daily chart for Fortis (2025) illustrates key technical setups including two clearly labeled non-linear base formations, a major pivot breakout, and subsequent price consolidation zones. The chart captures the transition from range-bound action to a strong bullish move, highlighting the “Getting Tight” pattern before this recent surge. Additional metrics such as moving averages, volume overlays, and stock fundamentals are visible, providing a comprehensive overview for swing or positional traders seeking technical clarity.
Haftungsausschluss
Die Informationen und Veröffentlichungen sind nicht als Finanz-, Anlage-, Handels- oder andere Arten von Ratschlägen oder Empfehlungen gedacht, die von TradingView bereitgestellt oder gebilligt werden, und stellen diese nicht dar. Lesen Sie mehr in den Nutzungsbedingungen.
Haftungsausschluss
Die Informationen und Veröffentlichungen sind nicht als Finanz-, Anlage-, Handels- oder andere Arten von Ratschlägen oder Empfehlungen gedacht, die von TradingView bereitgestellt oder gebilligt werden, und stellen diese nicht dar. Lesen Sie mehr in den Nutzungsbedingungen.