📊 What the 1‑day chart for Brainbees Solutions currently shows
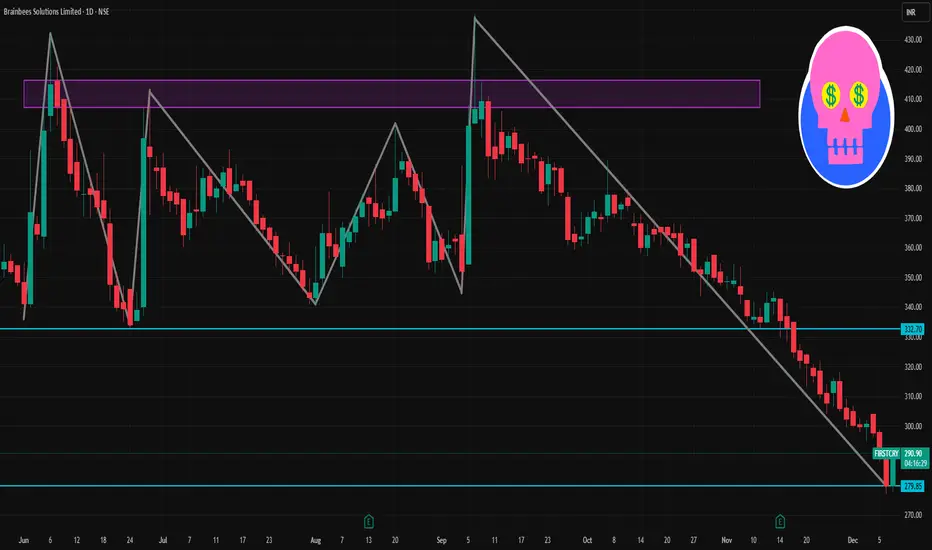
As of recent trading, the share price of Brainbees Solutions is around ₹ 279–290 on NSE.
The 52‑week high and low band shows a high near ~₹ 664–665 and a low around ~₹ 277–286.
That means at current ~₹ 280–290, the stock is very close to its 52‑week low — which may make the “day‑timeframe level” important for traders looking for a bounce or reversal.
Some technical‑analysis data (on certain days) show bearish momentum: for example, on a recent day the stock hit an all‑time low of ₹ 287, continuing a downtrend.
Verbundene Veröffentlichungen
Haftungsausschluss
Die Informationen und Veröffentlichungen sind nicht als Finanz-, Anlage-, Handels- oder andere Arten von Ratschlägen oder Empfehlungen gedacht, die von TradingView bereitgestellt oder gebilligt werden, und stellen diese nicht dar. Lesen Sie mehr in den Nutzungsbedingungen.