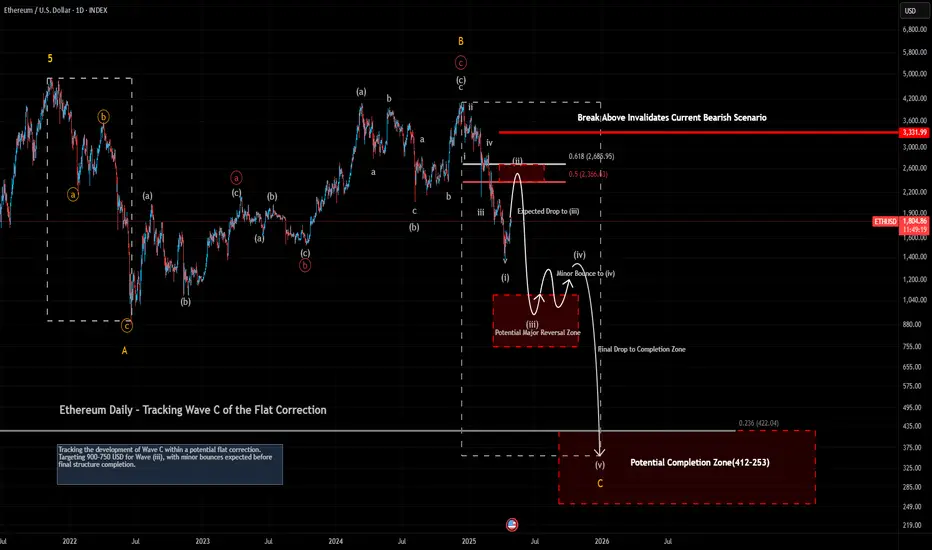
On the daily timeframe, Ethereum is unfolding within the early stages of Wave C, following the completion of a flat correction pattern.
The price has completed Wave (i) and appears to be in a corrective Wave (ii) targeting the 0.5–0.618 retracement zones (around $2366 to $2485).
Upon completion of Wave (ii), a sharp Wave (iii) decline towards the 1085–754 zone is expected.
📈 For a bigger picture, please refer to my Weekly and Monthly Ethereum analyses.
#Ethereum #ETH #DailyChart #CryptoAnalysis #TechnicalAnalysis #ElliottWave #CryptoTrading
Haftungsausschluss
Die Informationen und Veröffentlichungen sind nicht als Finanz-, Anlage-, Handels- oder andere Arten von Ratschlägen oder Empfehlungen gedacht, die von TradingView bereitgestellt oder gebilligt werden, und stellen diese nicht dar. Lesen Sie mehr in den Nutzungsbedingungen.
Haftungsausschluss
Die Informationen und Veröffentlichungen sind nicht als Finanz-, Anlage-, Handels- oder andere Arten von Ratschlägen oder Empfehlungen gedacht, die von TradingView bereitgestellt oder gebilligt werden, und stellen diese nicht dar. Lesen Sie mehr in den Nutzungsbedingungen.