Dynamatic Technologies is showing signs of a bullish breakout from a long consolidation phase, with a potential upside target of ₹13,900–₹14,000 based on the rectangle chart pattern.
📈 Understanding the Rectangle Breakout in Simple Terms
In the world of stock charts, a rectangle pattern is like a pause in a conversation. The price moves sideways within a defined range — bouncing between a top (resistance) and bottom (support) — without making any big moves up or down. This phase is called consolidation, and it often reflects indecision among buyers and sellers.
Rectangle pattern forms when a stock trades between two horizontal lines for a period of time.
Breakout happens when the price finally moves above the resistance line, signaling renewed buying interest.
Breakdown is the opposite — when price falls below support, indicating selling pressure.
This pattern is useful because it helps traders spot potential turning points. Once the breakout occurs, it often leads to a strong price move in the direction of the breakout.
🔍 Dynamatic Technologies: What’s Happening Now?
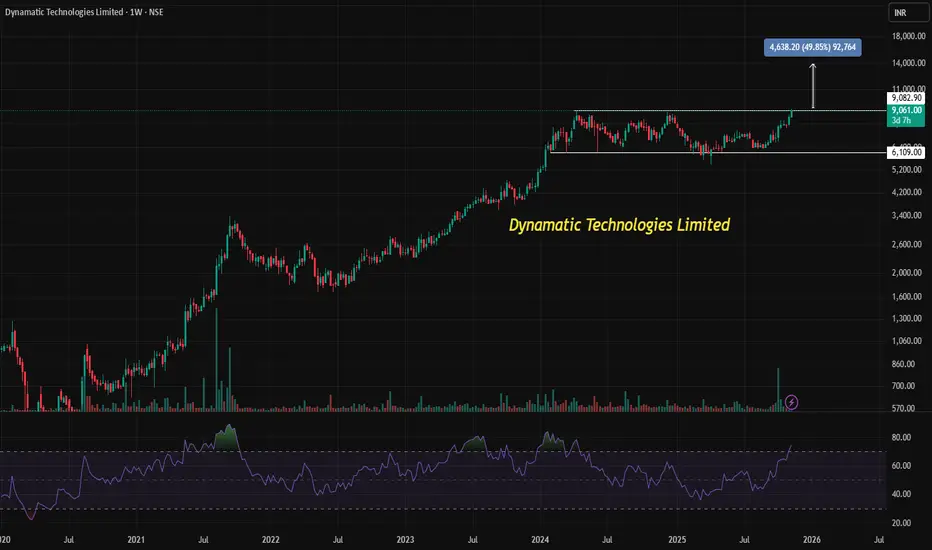
Dynamatic Technologies Ltd. has been trading in a tight range since April 2024, forming a textbook rectangle pattern on its weekly chart. As of early November 2025, the stock is attempting a positive breakout, currently trading around ₹9,060.
Here’s what makes this breakout noteworthy:
Long consolidation: The stock has been range-bound for over 1.6 years, which builds up potential energy for a strong move.
RSI strength: The Relative Strength Index (RSI), a momentum indicator, has climbed above 70 — a sign that buying momentum is picking up.
Volume and price action: A breakout accompanied by rising volume and strong price movement often confirms the trend.
🎯 How Is the Target Calculated?
The beauty of the rectangle pattern is its simplicity in estimating price targets. The expected move after a breakout is often equal to the height of the rectangle — the distance between the support and resistance levels.
Suppose the rectangle ranged between ₹6,000 and ₹9,000.
The height is ₹3,000,
Add this to the breakout level (₹9,000), and you get a target of ₹12,000.
In Dynamatic’s case, the projected move is even more ambitious — aiming for ₹13,900 to ₹14,000, which suggests a larger rectangle height or a more aggressive breakout.
🧠 Why It Matters for Investors
Rectangle breakouts are popular among traders because they offer:
Clear entry and exit points: Buy on breakout, set stop-loss below support.
Defined risk-reward: The height of the rectangle helps estimate potential gains.
Momentum confirmation: Indicators like RSI help validate the breakout strength.
For long-term investors, such patterns can signal a shift in trend — from sideways to upward — especially when backed by strong fundamentals or news, like Dynamatic’s recent aerospace partnership
✅ Final Thoughts
Dynamatic Technologies is showing technical strength with a rectangle breakout, supported by rising RSI and bullish price action. If the breakout sustains, the stock could potentially reach ₹13,900–₹14,000, offering a compelling opportunity for momentum-driven investors.
📈 Understanding the Rectangle Breakout in Simple Terms
In the world of stock charts, a rectangle pattern is like a pause in a conversation. The price moves sideways within a defined range — bouncing between a top (resistance) and bottom (support) — without making any big moves up or down. This phase is called consolidation, and it often reflects indecision among buyers and sellers.
Rectangle pattern forms when a stock trades between two horizontal lines for a period of time.
Breakout happens when the price finally moves above the resistance line, signaling renewed buying interest.
Breakdown is the opposite — when price falls below support, indicating selling pressure.
This pattern is useful because it helps traders spot potential turning points. Once the breakout occurs, it often leads to a strong price move in the direction of the breakout.
🔍 Dynamatic Technologies: What’s Happening Now?
Dynamatic Technologies Ltd. has been trading in a tight range since April 2024, forming a textbook rectangle pattern on its weekly chart. As of early November 2025, the stock is attempting a positive breakout, currently trading around ₹9,060.
Here’s what makes this breakout noteworthy:
Long consolidation: The stock has been range-bound for over 1.6 years, which builds up potential energy for a strong move.
RSI strength: The Relative Strength Index (RSI), a momentum indicator, has climbed above 70 — a sign that buying momentum is picking up.
Volume and price action: A breakout accompanied by rising volume and strong price movement often confirms the trend.
🎯 How Is the Target Calculated?
The beauty of the rectangle pattern is its simplicity in estimating price targets. The expected move after a breakout is often equal to the height of the rectangle — the distance between the support and resistance levels.
Suppose the rectangle ranged between ₹6,000 and ₹9,000.
The height is ₹3,000,
Add this to the breakout level (₹9,000), and you get a target of ₹12,000.
In Dynamatic’s case, the projected move is even more ambitious — aiming for ₹13,900 to ₹14,000, which suggests a larger rectangle height or a more aggressive breakout.
🧠 Why It Matters for Investors
Rectangle breakouts are popular among traders because they offer:
Clear entry and exit points: Buy on breakout, set stop-loss below support.
Defined risk-reward: The height of the rectangle helps estimate potential gains.
Momentum confirmation: Indicators like RSI help validate the breakout strength.
For long-term investors, such patterns can signal a shift in trend — from sideways to upward — especially when backed by strong fundamentals or news, like Dynamatic’s recent aerospace partnership
✅ Final Thoughts
Dynamatic Technologies is showing technical strength with a rectangle breakout, supported by rising RSI and bullish price action. If the breakout sustains, the stock could potentially reach ₹13,900–₹14,000, offering a compelling opportunity for momentum-driven investors.
Haftungsausschluss
Die Informationen und Veröffentlichungen sind nicht als Finanz-, Anlage-, Handels- oder andere Arten von Ratschlägen oder Empfehlungen gedacht, die von TradingView bereitgestellt oder gebilligt werden, und stellen diese nicht dar. Lesen Sie mehr in den Nutzungsbedingungen.
Haftungsausschluss
Die Informationen und Veröffentlichungen sind nicht als Finanz-, Anlage-, Handels- oder andere Arten von Ratschlägen oder Empfehlungen gedacht, die von TradingView bereitgestellt oder gebilligt werden, und stellen diese nicht dar. Lesen Sie mehr in den Nutzungsbedingungen.