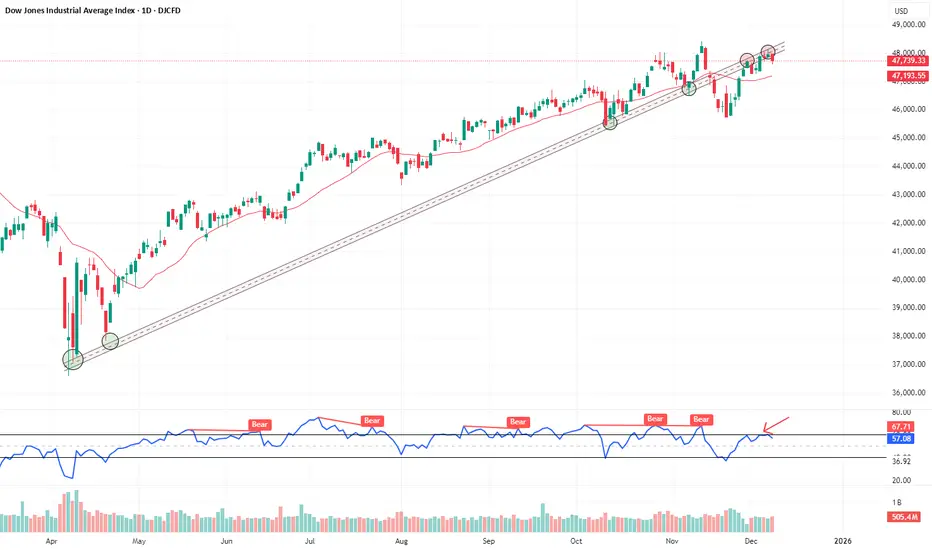
Clear trendline role reversal in play — previous support now acting as strong resistance📉
Price rejection seen near:
🔹 Trendline resistance
🔹 RSI bearish range shift (marked by repeated failures to cross 60)
🔹 Fib 0.786 retracement zone (not shown in chart)
All confluences suggest a potential pause or short-term pullback unless price breaks out with strong volume.
Price rejection seen near:
🔹 Trendline resistance
🔹 RSI bearish range shift (marked by repeated failures to cross 60)
🔹 Fib 0.786 retracement zone (not shown in chart)
All confluences suggest a potential pause or short-term pullback unless price breaks out with strong volume.
Haftungsausschluss
Die Informationen und Veröffentlichungen sind nicht als Finanz-, Anlage-, Handels- oder andere Arten von Ratschlägen oder Empfehlungen gedacht, die von TradingView bereitgestellt oder gebilligt werden, und stellen diese nicht dar. Lesen Sie mehr in den Nutzungsbedingungen.
Haftungsausschluss
Die Informationen und Veröffentlichungen sind nicht als Finanz-, Anlage-, Handels- oder andere Arten von Ratschlägen oder Empfehlungen gedacht, die von TradingView bereitgestellt oder gebilligt werden, und stellen diese nicht dar. Lesen Sie mehr in den Nutzungsbedingungen.