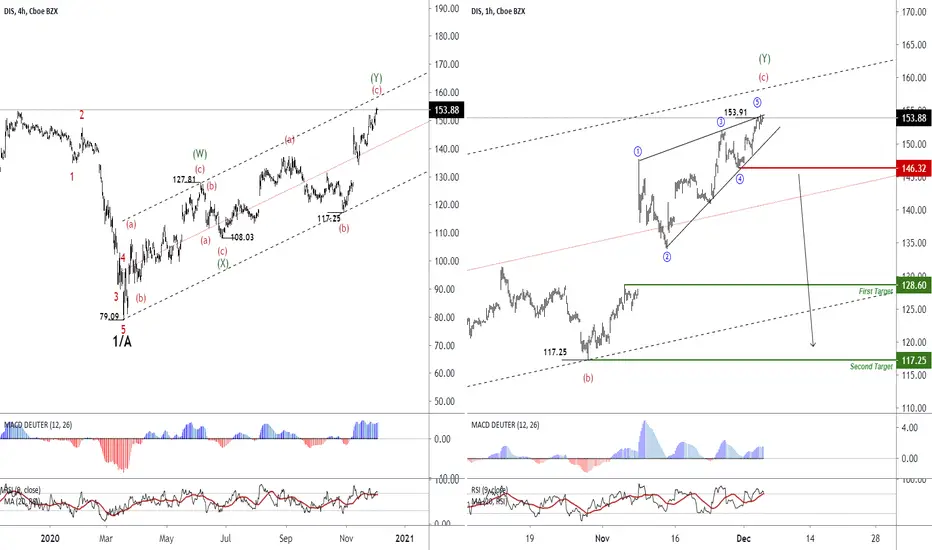
In the 240-minute chart, we have 5 descending waves, which have ended in the range of 79.09, in continuation, the correction of this downtrend is in the form of Double Zigzag, which has reached the range of $ 153.91. The Diagonal pattern has been formed in this range, of which the targets can be 128.60 and then $ 117.25.
In case the visualization of this analysis become true, the main pattern will be Expanded Flat and we can consider the expansion of the bearish trend up to the range of $ 79.09.
In case the visualization of this analysis become true, the main pattern will be Expanded Flat and we can consider the expansion of the bearish trend up to the range of $ 79.09.
Haftungsausschluss
Die Informationen und Veröffentlichungen sind nicht als Finanz-, Anlage-, Handels- oder andere Arten von Ratschlägen oder Empfehlungen gedacht, die von TradingView bereitgestellt oder gebilligt werden, und stellen diese nicht dar. Lesen Sie mehr in den Nutzungsbedingungen.
Haftungsausschluss
Die Informationen und Veröffentlichungen sind nicht als Finanz-, Anlage-, Handels- oder andere Arten von Ratschlägen oder Empfehlungen gedacht, die von TradingView bereitgestellt oder gebilligt werden, und stellen diese nicht dar. Lesen Sie mehr in den Nutzungsbedingungen.